Effect of pressure on the structural properties of tantalum carbide
Abstract
In this study, tantalum carbide (TaC) samples were placed in a diamond anvil cell to study the equation of state at room temperature and high pressure using synchrotron radiation X-ray diffraction. By fitting the data at ambient pressure and up to the highest pressure of 38.5GPa, we obtained the bulk modulus and first derivative of TaC as K0=290.7K0=290.7 (6.8) GPa and K′0=3.05 (0.49), respectively. In addition, we calculated the bulk modulus and band structure of TaC under high pressure using density functional theory. The obtained bulk modulus is 267 (3)GPa. TaC is metallic in nature throughout the entire pressure range. We studied the high-pressure deviatoric stress of TaC using linewidth analysis method. We found that TaC can support a maximum differential stress of up to 18.6GPa at the highest pressure of 38.5GPa.
1. Introduction
In previous work, the high-pressure studies of cubic carbides such as SiC,1,2,3,4,5 TiC,6,7,8,9,10,11,12,13,14 ZrC,8,10,11,13,15,16,17,18,19,20,21,22,23,24,25,26 VC,23,27,28 NbC29,30,31 and HfC9,10,13,19,32,33 have attracted widespread attention. Tantalum carbide (TaC) is a very important cubic carbide. TaC has many advantages such as high strength, high hardness, high melting point (3880∘), good chemical stability, strong conductivity and high thermal conductivity.34,35,36,37,38,39,40,41,42,43,44 Krajewski et al.34 calculated the bulk modulus of TaC, and the derived result is 188GPa. Brown et al.43 obtained the Young’s modulus, shear modulus and Poisson’s factor of TaC by theoretical calculations as 382GPa, 163GPa and 0.17, respectively. Sahnoun et al.35 chose generalized gradient approximation (GGA) for electron density function of first-principles theory calculations, and the derived bulk modulus is 319GPa. Chen et al.44 studied the hardness of nano-TaC using the diamond indentation method and obtained a Vickers hardness of 19.2GPa. Yang and Gao36 conducted first-principles theoretical calculations and obtained the bulk modulus, shear modulus, Young’s modulus and Poisson’s ratio of NiAs-type TaC at ambient pressure as 283GPa, 165GPa, 415GPa and 0.256, respectively. Chen et al.37 used first-principles calculations and derived the bulk modulus of TaC with 310 (2)GPa.
Although many experimental studies and theoretical calculations have investigated the high-pressure compression and mechanical properties of TaC,34,35,36,37,43,44 there is significant controversy over the ambient pressure bulk modulus of TaC (188–319GPa). In this paper, we investigated the high-pressure structural stability of TaC to 38.5GPa in a diamond anvil cell (DAC) using silicone oil as the pressure transition medium. In addition, we calculated the band structure of TaC to 40GPa using first principles theory.
2. Experimental Details
TaC with a purity of 99.9% for high-pressure experiments was supplied by a commercial company of Beijing Haoke Technology Co., Ltd. Under room pressure and room temperature conditions, the crystal structure of TaC is a face-centered cubic structure with a space group of Fm-3m (see Fig. 1). We have analyzed TaC samples using scanning electron microscopy (SEM). It can be seen that the average grain size of TaC is about 300nm (see Fig. 2). The model of the copper target X-ray diffraction (XRD) instrument is EMPYREAN, and the wavelength of XRD is 1.5406Å. At room pressure and room temperature conditions, the XRD experimental pattern of copper target is shown in Fig. 3, and the obtained cell parameters are a=b=c=4.4590 (0.0001)Å. A DAC with a diamond culet of 300μm was selected for high pressure experiments of TaC. A T301 gasket is pre-pressed to a thickness of approximately 30μm. A circular hole with a diameter of 120μm is made using a laser drilling device in the gasket. A ruby chip with a diameter of 10μm is placed near the center of the sample hole as a pressure sensor.45 In the high-pressure experiments, silicone oil was used as a pressure transmitting medium.
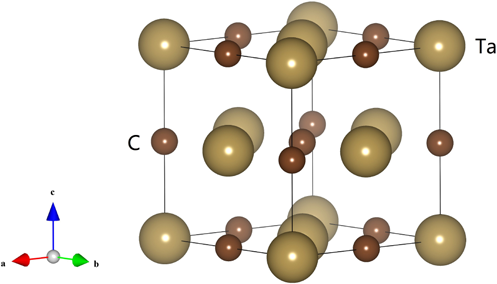
Fig. 1. (Color online) Crystal structure and three-dimensional atomic orientation of TaC.

Fig. 2. (Color online) SEM images of TaC sample at ambient conditions.
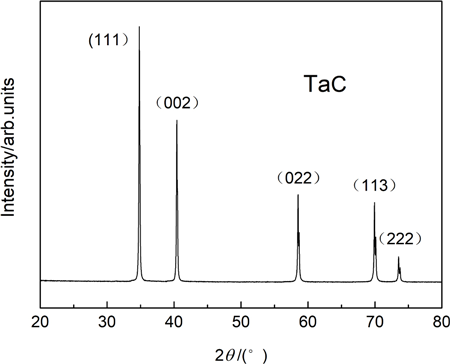
Fig. 3. Representative powder XRD of TaC in ambient conditions with each peak marked by corresponding Miller indices, and the x-ray wavelength is λ=1.5406 Å.
In-situ high-pressure synchrotron radiation XRD experiments were completed at the BL15U1 beam line station of Shanghai Synchrotron Radiation Facility (SSRF). The wavelength of synchrotron radiation is 0.619900Å. The used detector is a MarCCD detector. A CeO2 standard sample is used to calibrate the distance from the detector to the sample and the deflection angle of the detector. The exposure time for each diffraction spectrum is 20–30s. Subsequently, Fit2d software was used for data processing and analysis to obtain diffraction patterns at different pressures.46 Based on the Rietveld method, the model was refined under the space group of Fm-3m using the GSAS+EXPGUI program.
3. Computational Method
The density functional theory (DFT) calculation is implemented by the CASTEP program,47 and the Perdew–Burke–Ernzerhof (PBE) function48 is used as the exchange correlation function for the structure optimization and entropy function. The relationship between real electronic and valence electrons is calculated using projection fixed plane wave (PAW). The used electron density function is GGA. The valence electrons of C and Ta are 2s22p2 and 4f145d36s2, respectively. Monkhorst pack method is used for Brillouin region integration of TaC system, and the chosen integration grid is 10×10×10. The truncation energy of PAW basis function was measured, and its conversion accuracy is less than 10−7ev.
4. Results and Discussion
Fit2d software46 was used to study the diffraction patterns obtained by MarCCD detector. The ruby pressure sensor45 is used to determine the pressure, and the highest pressure in the experiments is 38.5GPa. Figure 4 shows the diffraction patterns of TaC under different pressures. Peaks (111), (002) and (022) of the face-centered cubic phase has always existed throughout the entire pressure range. At low pressures, the diffraction intensity of peak (111) is slightly higher than that of peak (002). But above 13.4GPa, the diffraction intensity of the peak (002) is slightly higher than that of the peak (111). The result indicates that TaC may undergo a preferred orientation (texture) on the 002 crystal plane. In addition, there are no new peaks or old peaks disappear. Therefore, we believe that TaC does not experience a structural phase transition under high pressure.
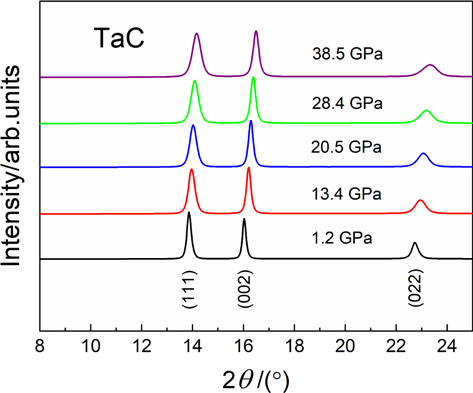
Fig. 4. (Color online) Effect of pressure on normalized XRD patterns of TaC.
Through the refinement results of GSAS (see Fig. 5), the cell parameters and volume of TaC under different pressures can be obtained. The data on the variation of normalized volume with pressure is fitted by the third-order Birch–Murnaghan equation. Meanwhile, K0 and K0′ can be fitted from the following equation49 :

Fig. 5. (Color online) Rietveld refinement results of TaC powder at (a) 1.2GPa and (b) 38.5GPa, respectively. The red circle represents the data points. The black curve represents the fitted curve. The green curve represents the background curve. The purple curve represents the difference between the data and the fitting results. The vertical ticks mark the positions of the Bragg peaks.
The curve of the normalized volume versus pressure is shown in Fig. 6. It can be seen that the cubic structure was maintained to the highest experimental pressure of 38.5GPa. Using the Birch–Murnaghan equation to fit the volume data under different pressures, we derived the bulk modulus and its first derivative as 290.7 (6.8)GPa and 3.05 (0.49), respectively. In addition, the bulk modulus of TaC calculated theoretically in present work is 267 (3)GPa, which is slightly lower than the experimental result derived in this work. The difference between the theoretical bulk modulus and the experimental bulk modulus is attributed to the nonhydrostaticity of the pressure medium. First, DAC is a nonhydrostatic stress device for the experimental measurements. Only when the sample is contained in a fluid pressure medium can true hydrostatic pressure conditions be obtained. At room temperature, due to the solidification of the pressure-transmitting medium silicone oil, the quasi-hydrostatic environment cannot be maintained above ∼15GPa.50 The pressure-transmitting medium silicone oil is known not to be quasi-hydrostatic over most of the pressure range investigated in the present study. For a long time, it has been recognized that the presence of nonhydrostatic stress can lead to deviations in the determination of the equation of state (EOS) in DAC. This could result in an overestimation of the bulk modulus by 10–20%. Therefore, the determination of bulk modulus under nonhydrostatic conditions may be incorrect. Second, the appearance of preferred orientation is probably linked to the stiffening of the silicone oil. Because differential stress can cause grains to aggregate and arrange in certain directions, and increase the probability of orientation in these directions, leading to a phenomenon known as preferred orientation. The high bulk modulus of TaC may be closely related to its high electron spatial density of 3.56/Å3.

Fig. 6. (Color online) Normalized compression curves of TaC under high pressure. The line is a Birch–Murnaghan fit for experimental data, while the dotted line is a Birch–Murnaghan fit for theoretical calculation results.
A comparison of the bulk modulus and first derivative of TaC and some cubic carbides is shown in Table 1. In the present work, the bulk modulus of TaC at ambient conditions is close to those value obtained by Sahnoun et al.,35 Yang and Gao,36 and Chen et al.,37 much higher than the result derived by Krajewski et al.34 It can be seen that, the bulk modulus of TaC obtained from experiments in present work is higher than the bulk modulus of SiC,1,2,3,4,5 TiC,6,7,8,9,10,11,12,13,14 ZrC,8,10,11,13,15,16,17,18,19,20,21,22,23,24,25,26 close to the bulk modulus of VC,23,27,28 lower than the value of NbC derived by Weber29 and Chen et al.31 and close to that of NbC obtained by Singh et al.,30 higher than the bulk modulus of HfC,13,19,32,33 lower than that of HfC derived by Chauhan and Gupta,10 and close to the value of HfC obtained by Xiong et al.9
| Sample | Method | K0(GPa) | K′0 |
|---|---|---|---|
| TaC | Present-Exp. | 290.7 (6.8) | 3.05 (0.49) |
| Present-Cal. | 267 (3) | — | |
| Cal. | 18834 31935 28336 310 (2)37 | — | |
| SiC | Exp. | 2241 | |
| Cal. | 2122 2493 2004 2115 | 3.72 3.23 7.34 | |
| TiC | Exp. | 2336 2637 2408 | |
| Cal. | 249.4 (0.1)9 252.8010 27311 25112 25712 22813 27014 | 3.94 (0.01)9 | |
| ZrC | Exp. | 2348 22315 23016 20717 22018 | |
| Cal. | 222.8810 23711 21719 22420 21821 23222 22423 22524 230.525 22926 26513 | 4.0510 3.8623 | |
| VC | Cal. | 30223 29027 30428 | 4.0423 |
| NbC | Exp. | 34029 | |
| Cal. | 28830 33331 | ||
| HfC | Exp. | 286.2 (4.8)9 | 3.65 (0.31)9 |
| Cal | 310.3310 228.232 23619 21813 26533 | 2.90810 3.8832 |
According to the theory,51 we can analyze the deviatoric stress under high pressure through linewidth analysis. Define 2ω as the full width at half maximum (FWHM) amplitude of diffraction profile on the 2θ scale. We can obtain the microstrain η as,

Fig. 7. Widths (FWHM) of the diffraction peaks (111, 002, 022) of TaC at high pressures.
The deviatoric stress (strength) t can be expressed as,
The variation of deviatoric stress with pressure is shown in Fig. 8. Within the pressure range of 1.2–13.4GPa, the strength of TaC increases approximately linearly, indicating that TaC is in the stage of elastic deformation. But yield occurs above 13.4GPa, at which point TaC undergoes plastic deformation. After exceeding 20.5GPa, strength enhancement occurs. The strength increases linearly again, and the increase rate is greater than the elastic deformation in the first stage. At the maximum pressure of 38.5GPa, TaC has a maximum deviatoric stress of 18.6GPa.

Fig. 8. Deviatoric stress as a function of pressure for TaC.
Figure 9 shows the band structure of TaC under ambient pressure and high pressures using first principles theoretical calculations, and it can be seen that the band structure is consistent under high pressures without significant changes. Besides, TaC shows metallic to the highest pressure of 40GPa in the calculations.
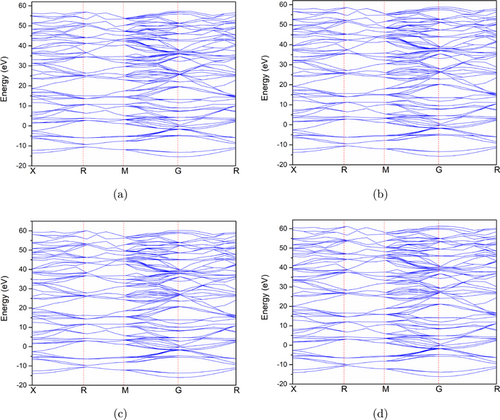
Fig. 9. (Color online) Calculated band structure of TaC at (a) 0GPa, (b) 14GPa, (c) 28GPa and (d) 40GPa, respectively.
The calculated the Young’s modulus, shear modulus, hardness, Poisson’s ratio and K/G of TaC at ambient conditions are 548GPa, 237GPa, 39.20GPa, 0.16 and 1.13, respectively. The isotropic and anisotropic properties of the bulk modulus, Young’s modulus, shear modulus, hardness and Poisson’s ratio of TaC under ambient pressure are shown in Fig. 10. It can be seen that, the bulk modulus shows isotropic but Young’s modulus, shear modulus, hardness and Poisson’s ratio show anisotropic properties.
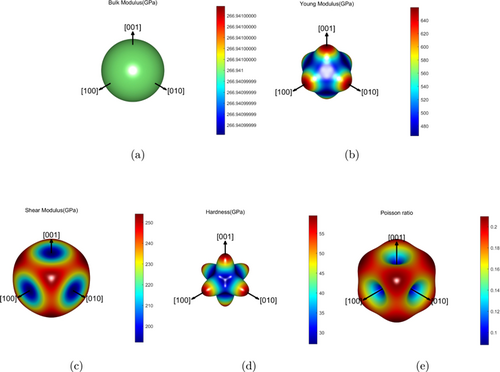
Fig. 10. (Color online) Isotropic and anisotropic properties of bulk modulus, Young’s modulus, shear modulus, hardness and Poisson’s ratio of TaC at ambient conditions.
The anisotropy degrees of Young’s modulus, shear modulus, hardness and Poisson’s factor are 29.52%, 24.40%, 54.46% and 57.96%, respectively. At the position of (0, 0, 1), the Young’s modulus and hardness are the highest, but at this point, the shear modulus and Poisson’s factor are the lowest. The Young’s modulus and hardness are the lowest at the position of (−0.57852, −0.57852, 0.57501), but the shear modulus and Poisson’s factor are the highest at the same position.
5. Conclusions
In conclusion, in the quasi-hydrostatic environment of a DAC, the high-pressure structure and EOS of TaC were studied to 38.5GPa. We found that there was no structural phase transition in TaC, and the obtained bulk modulus was 290.7 (6.8)GPa. It can be seen that when the TaC sample undergoes plastic deformation at the pressure of 13.4GPa, yielding occurs. At the maximum pressure of 38.5GPa, TaC can support a maximum deviatoric stress, t, as high as 18.6GPa. In addition, we calculated the elastic constant of TaC using first principles theory and found that the bulk modulus is isotropic, while the Young’s modulus, shear modulus and Poisson’s factor are anisotropic. The high-pressure band structure of TaC has not undergone significant changes, and the material exhibits metallicity in the whole pressure range.
Acknowledgments
The authors acknowledge the financial supports from the National Natural Science Foundation of China (Grant No. 12075163) and Natural Science Foundation of Sichuan Province, China (Grant No. 22NSFSC1989).
| You currently do not have access to the full text article. |
|---|


