Investigation of artifacts by mapping SAR in thermoacoustic imaging
Abstract
Microwave-induced thermoacoustic imaging (MI-TAI) remains one of the focus of attention among biomedical imaging modalities over the last decade. However, the transmission and distribution of microwave inside bio-tissues are complicated, thus result in severe artifacts. In this study, to reveal the underlying mechanisms of artifacts, we deeply investigate the distribution of specific absorption rate (SAR) inside tissue-mimicking phantoms with varied morphological features using both mathematical simulations and corresponding experiments. Our simulated results, which are confirmed by the associated experimental results, show that the SAR distribution highly depends on the geometries of the imaging targets and the polarizing features of the microwave. In addition, we propose the potential mechanisms including Mie-scattering, Fabry-Perot-feature, small curvature effect to interpret the diffraction effect in different scenarios, which may provide basic guidance to predict and distinguish the artifacts for TAI in both fundamental and clinical studies.
1. Introduction
Microwave-induced thermoacoustic imaging (MI-TAI) is a hybrid imaging modality, which features noninvasiveness, rich electromagnetic contrast, deep tissue penetration and high spatial resolution.1,2,3,4,5,6,7,8,9,10 It has been widely applied in biomedical applications, such as cancer diagnosis,1,2,3 joint evaluation,4,5,6 brain imaging7,8,9 and endoscopy.10 In principle, TAI involves the process of exciting ultrasonic waves inside biological tissue with pulsed/modulated microwave (MW). The generated ultrasonic waves, which carry inherent characteristics of tissues such as complex permittivity, conductivity and Grüneisen coefficient, are detected by the transducer and then reconstructed using appropriate mathematical algorithms.11,12
The reconstructed TAI images often suffer from severe artifacts, as usually induced by the diffraction effect of MW, even with homogeneous illumination and appropriate reconstruction algorithm. The nature of MW applied in TAI manifests itself in diffraction, which hampers attempts to determine the actual location and size of targets. According to Refs. 13 and 14, one type of image artifacts, termed as splitting, always exists in reconstructing cylindrical objects excited with linearly polarized MW. Factors as dielectric properties, location, size and orientation of the target, and the MW polarization are considered to contribute to these artifacts. Recently, circularly polarized (CP) MW has been proposed to eliminate the artifact of “splitting”.15,16 Besides, artifacts in long-tube-shaped17 and vasculature-shaped targets18 as well as wood sample19 can also be found. It is noted the aforementioned artifacts are principally related to the interaction between MW and targets, which are quite different with other types of artifacts, e.g., sound-speed-related artifacts induced by the heterogeneous sound speed,20 streak artifacts induced by the limited-angle sampling21 and negativity artifacts induced by the limited number of transducers and the limited bandwidth of the transducer.22 Although literatures have continuously reported artifacts that involved with interaction between MW and tissue/tissue-like targets, the interpreted mechanisms, i.e., scattering23 and diffraction effect15,16 are unfortunately insufficient for deeper understandings.
In this paper, we explore the diffraction effect accompanied by Mie scattering and Fabry-Perot resonance that may function as the main contributors to produce image artifacts in TAI. Using finite element method (Comsol Multiphysics 5.5),10 we first calculate the distribution of SAR by simulating tissue phantoms with varied shapes, sizes and thicknesses, as illuminated by microwave at 3GHz. Our simulation and experimental results show that SAR is heterogeneous under linear polarizations, and the artifact pattern varies depending on the shapes and sizes of the targets. Even with circular polarization microwave illumination and advanced mathematical algorithms, various artifacts still exist. The corresponding phantom and ex vivo tumor experiments are carried out to validate the conclusion of the simulation results. The main contribution of this study may include: (1) we propose mechanisms that govern the existence of more universal artifacts in TAI. (2) we verify that artifacts cannot be eliminated even the circularly polarized MW is employed. We believe our work can be used to predict and distinguish the artifacts in TAI.
2. Methods
The tumor-mimicking phantom essentially blocks the propagation path of MW. Due to the size effect and mismatch of permittivity, scattering, refraction and reflection will inevitably occur.22 In the following, we briefly introduce two fundamental mechanisms that may explain the existence of artifacts in TAI: Mie scattering and Fabry–Perot feature that associated with the presented SAR patterns. First, Mie scattering takes place when the diameter or side length of the target approximately equals to the wavelength of MW in the target. Second, the tumor-mimicking phantom can be regarded as an optical cavity, due to the reflection from the faces of the cylinder, Fabry–Perot featured SAR pattern can thus be found.
In the following, we introduce both the simulation and experimental methods for mapping SAR.
2.1. Simulation parameters
The SAR, representing the electromagnetic (EM) energy absorbed per unit mass of tissue at a given frequency,12 is generally used and can be calculated by Eq. (1) :
We elucidate the general fundamentals of the SAR distribution in phantoms with varied morphologies. At the beginning, simulations on SAR mapping were performed with finite element method. Subsequently, reconstructed TAI images were provided for comparison. We initiated our numerical study of the SAR inside a finite tumor phantom, which is dielectrically homogenous. The tumor phantom owns a relative permittivity of εr1=55, a conductivity of σ1=2S/m,24,25 and the associated density is ρ1=1050kg/m3. The tumor phantom is placed in transformer oil, that provides a relative permittivity of εr2=2.2 and a conductivity of σ2=10−12S/m,26 and the corresponding density ρ2=850kg/m3. A plane wave that propagates along z-direction with a central frequency 3.0GHz is employed as the radiation source. The wavelength in the tumor-mimicking phantom is denoted as λa, which is calculated to be 13.5mm. Note that incident wave is linearly polarized, and the polarization direction is parallel to x-axis. It is also noted that in the image reconstruction process, we follow the treatment provided in Ref. 14, that both tumor-mimicking phantom and transformer oil are assumed to have the uniform sound speed. In reality, the speed of ultrasound wave in these two mediums differs, and thus may introduce discrepancy between the simulation and experimental results. However, according to Refs. 13 and 14, the artifacts induced by the interaction between MW and phantom targets are scarcely affected.
2.2. Experimental setup
To provide evidence to the exact distribution of microwave energy in different targets, we set up a conventional circular-scanning-based TAI system as shown in Fig. 1. A home-made MW generator with a central frequency of 3GHz and a peak power of 60kW produces MW pulses at a maximum repetition rate ∼100Hz. We noted that the 3GHz frequency microwave source is appropriate for high-penetration-depth involved applications, such as joint evaluation,27 breast cancer imaging28 and TA endoscopy.29 Besides, the high peak power can guarantee a relatively high signal to noise ratio (SNR).30 A dipole antenna with a volume of 60 mm × 60 mm × 45 mm was used to deliver the linearly polarized microwave pulses. A circular horn antenna with a diameter of 130mm was applied for the circular-polarization-related experiments. The pulse duration is tunable from 300ns to 550ns. A 3-m long semi-rigid coaxial cable was used to transmit microwaves from microwave generator to antennas. The electric field of the incident microwave with linear polarization is assumed to be parallel to the x-axis (see Fig. 1). MW pulses were set to propagate along z-direction.
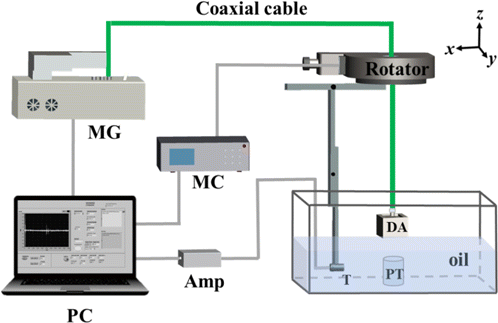
Fig. 1. Experiment setup for TAI. The phantom and transducer were placed in a tank filled with the transformer oil. Microwave is illuminating along z-direction. MG: MW generator, MC: motor controller AMP: Amplifier; DA: Dipole antenna; PT: phantom target; T: Transducer.
For ultrasonic detection, we used a flat transducer (V303, Olympus Inc.) with a central frequency of 1MHz, which owns an active area of 0.5 inch in diameter, and a relative bandwidth of 56%. The TA spectra response of all tumor phantoms are mainly located below 1MHz; however, the resolution provided by such flat transducer was insufficient which prohibits to show the detailed SAR pattern. Such issue becomes more challenging once complex SAR appears in the right square prism and regular triangular prism phantom targets. Additionally, SNR drops due to the circularly polarized MW was employed.15 To gain a better visibility, a cylindrically focused transducer (V309, Olympus Inc.) with a central frequency of 5MHz, a focal length of 2 inches and a relative bandwidth of 76% was used for investigating SAR patterns in the right square prism and regular triangular prisms. To achieve 360∘ scanning with a step of 2∘, the transducer was fixed on a motorized rotator (RAP125, Zolix Inc). The TA signals were averaged 100 times at each scanning position to improve the SNR and amplified by a 60-dB home-made preamplifier before transferred to a computer. Finally, these signals were digitized by a 12-bit data acquisition card (PCI-5122, National Instruments, TX) with a sampling rate of 100MS/s and then stored in a computer. Image reconstruction was performed based on a delay-and-sum (DAS) algorithm using MATLAB (R2016b, MathWorks). DAS algorithm is a well-known tool for the high-efficiency reconstruction of thermoacoustic images; however, negativity and diffraction-involved artifacts are commonly found. It is possible to distinguish these two types of artifacts according to the image of “splitting”, as reported from Ref. 13.
2.3. Phantoms preparation
We used six phantoms to perform experiments to compare with simulation results. The base material applied for the phantom was 2% agar gel in deionized water. In order to obtain a better SNR, 5% salt was added to the phantom to enhance the absorption of MW energy. We conducted different sets of phantom experiments to investigate the influence of the size and geometry of targets on the linear/circular polarization microwave energy distribution. The related geometrical parameters of all phantoms are provided in Table 1.
| Phantom No. | Shape | Thickness/mm | Diameter or side length/mm |
|---|---|---|---|
| 1 | Cylinder | 5 | 30 |
| 2 | Cylinder | 50 | 30 |
| 3 | Cylinder | 50 | 8 |
| 4 | Cylinder | 50 | 15 |
| 5 | Right square prism | 50 | 30 |
| 6 | Regular triangular prism | 50 | 30 |
3. Results and Discussions
Boundary mode analysis confirms that, the image splitting in terms of two side lobes as oriented at y-axis occurs, we attribute the splitting to the current density that distributed along x-direction Jx (or termed as “Eddy” current32), and consequently producing magnetic fluxes (Fig. S1 in the supplementary material). We note that in the cross-section of phantom 1, the magnetic field Hz appears as magnetic dipole moment (Fig. S2 in the supplementary material), which is quite similar to the H102-mode in a lossy open dielectric sphere.31 In addition, we numerically observed that the change of SAR along z-direction is not obvious, which are confirmed by the following TA images. The reason may be attributed to the small thickness in the scale of sub-wavelength.
For phantom 2, we assumed that similar two side lobes oriented at y-axis can also be found since the diameter keeps the same. However, it turns out that these two side lobes are oriented at x-axis instead. Second, apart from phantom 1, the distribution of Jx in phantom 2 is sensitive to the probing depth, as depicted by the varied SAR distributions probed at different depths shown in Figs. 2-(b1), 2-(b3), 2-(b5). For example, we find that the SAR near the edge of the phantom in Fig. 2-(b2), is more homogeneously distributed compared with Fig. 2-(b4). Simulation results were subsequently confirmed by phantom experimental results shown in Figs. 2-(b2), 2-(b4), 2-(b6). Third, we both numerically and experimentally noticed that there exists a dark gap between two bright patches which own maximal value of SAR in Fig. 2-(b6). Such phenomenon may be related to the multi-reflections generated by side walls of the cylindrical phantom, as in analogy to the light propagation in fiber. It is noted that real(√εr1):real(√εr2)=7.4:1.4. Fourth, we find that phantom 2 numerically exhibits a single patch of SAR that owns maximal value in the center of a relatively small region in depth, i.e., 32mm<z<38mm in Fig. 2(b). We therefore term it as a “focus” region. Besides, phantom 2 numerically demonstrates a similar pattern that shown in Fig. 2-(a1) at the probing position z=49.5mm. Unfortunately, the associated experimental results could not be found. We attribute to potential reasons including the limited sensitivity, and high-frequency-response of the applied flat transducer.
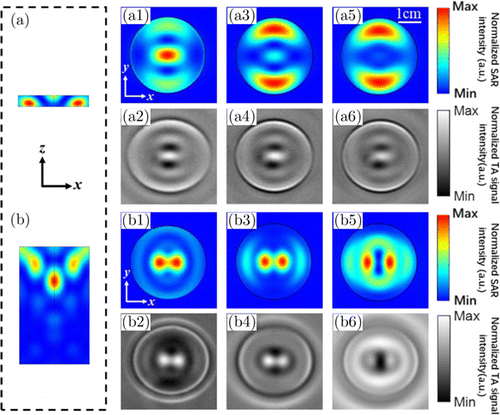
Fig. 2. Results from numerical calculations and TAI experiments for the SAR distribution in (a) phantom 1, and (b) phantom 2. Here, we take MW illumination with linear polarization that is x-oriented. (a1) ∼ (a6) Slices of SAR in phantom 1 at different probing depths: (a1, a2) z = 49.5mm, (a3, a4) z = 47.5mm, (a5, a6) z = 45.5mm. Note that (a1), (a3) and (a5) are obtained from numerical calculations, while (a2), (a4) and (a6) are obtained from TAI experiments. The top (bottom) surface of phantom 1 is located at z = 50mm (45mm). (b1) ∼ (b6) Slices of SAR in phantom 2 at different probing depths: (b1, b2) z/l = 0.6, (b3, b4) z/l = 0.35, (a5, b6) z/l = 0.1. Note that (b1), (b3) and (b5) are obtained from numerical calculations, while (b2), (b4) and (b6) are obtained from TAI experiments. The top (bottom) surface of phantom 2 is located at z = 50mm (0mm).
We lastly compare our results with previous work shown in Ref. 14, the SAR side-lobe-pattern as achieved by FEM method agrees well with what obtained from finite difference time domain method.14
In summary, both the simulation and experimental results reveal that the artifact problem is sensitive to the thickness of the target.
Figure 3 shows results of numerical calculations for the SAR distribution in phantoms 3 and 4 with different radii. We mapped SAR patterns on two cross-sections at probing position z/l = 0.25 and 0.75, respectively. As noted, the transversely distributed Mie-like mode (refer to Figs. 3(a)–3(e)) exist in phantom 3. Since the diameter of phantom 3 is comparable to λa, which satisfies the Mie scattering condition of 2r√εr1∕λa≈1, the Mie-like mode appears.33 Besides, image splitting occurs in any probing layer of phantom 3. We attribute the potential reason to the fact that multi-reflections that provided by two side walls along z-direction, was prohibited due to the sub-wavelength feature along x-direction [Fig. 3(a)].
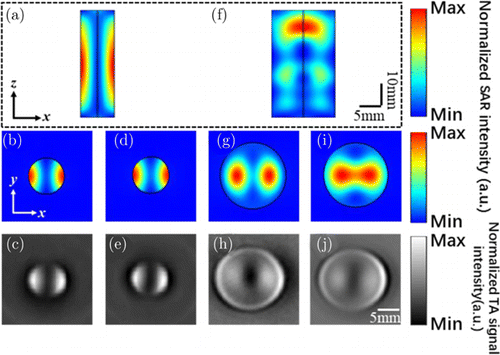
Fig. 3. Results from numerical calculations and TAI experiments for the SAR distribution in (a) phantom 3, and (f) phantom 4. Here, we take MW illumination with linear polarization that is x-oriented. (b)–(e) Slices of SAR in phantom 3 at different probing depths: (b, c) z/l = 0.25 and (d, e) z/l = 0.75. Note that (b) and (d) are obtained from numerical calculations, while (c) and (e) are obtained from TAI experiments. (g)–(j) Slices of SAR in phantom 3 at different probing depths: (g, h) z/l = 0.25 and (i, j) z/l = 0.75. Note that (g) and (i) are obtained from numerical calculations, while (h) and (j) are obtained from TAI experiments. The top (bottom) surface of phantom 3 and 4 is located at z = 50mm (0mm).
For phantom 4, however, the SAR demonstrates a more homogeneous distribution as shown in Figs. 3(f)–3(j). As the diameter here is comparable with the MW wavelength in phantom, multi-reflections provided by two side walls may occur, the guiding behavior in terms of Fabry–Perot-like modes along z-direction thus exist.
In summary, both the simulation and experimental results prove that the artifact problem is sensitive to the diameter of the target.
We also performed simulations on phantoms 5 and 6, as associated with right square and regular triangular prisms, respectively. To gain a better visibility, a cylindrically focused transducer as introduced in Sec. 2.2 was used. From Figs. 4(a) and 4(b), it is shown that the relatively large SAR is partially localized at the four corners of the rectangular, and the central region. Similar results can also be found in the SAR pattern for a regular triangular prism. It is noted that both TA images validate simulation results. The rectangular corner edge in phantom 5, where the radius of curvature is small and the geometric gradient is high, may help form an inductor. Consequently, the magnetic fluxes are formed, thus the current density may be localized at such region.34 This may explain the existence of four bright patches close to the four corners. The same explanation may also be applied to the SAR distribution in phantom 6 [see Figs. 4(c) and 4(d)].
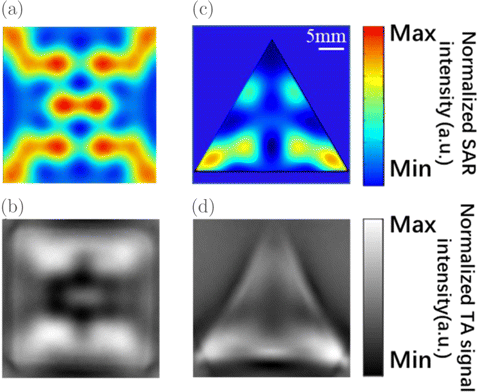
Fig. 4. Results from numerical calculations and TAI experiments for the SAR distribution in (a, b) phantom 5, and (c, d) phantom 6. Here, we take MW illumination with linear polarization that is x-oriented. Slices of SAR in phantoms 5 and 6 at the fixed probing depths: z/l = 0.16 and z/l = 0.09, respectively. Note that (a) and (c) are obtained from numerical calculations, while (b) and (d) are obtained from TAI experiments. The top (bottom) surface of phantom 5 and 6 is located at z = 50mm (0mm).
Both the simulation and experimental results illustrate that the artifact problem is sensitive to the morphology of the target.
Previous studies have shown that circularly polarized MW can potentially improve the image quality, as the image splitting no longer exists. However, the target is only limited to cylindrical phantoms. Here, we performed both simulation and TA imaging experiments to targets with different shapes, including phantoms 2, 5 and 6. The related results are depicted in Fig. 5. As noted, SAR distribution that is experimentally obtained, agrees well with those obtained by simulations. For example, in phantom 2, both results indicate that the bright spot exists at the center of the ring and it is surrounded by an external ring as shown in Figs. 5(a) and 5(b). In phantoms 5 and 6, due to the existence of corners which own small curvatures, the localization of SAR near corners can be found. It is noted that the reconstructed SAR patterns in Figs. 5(b), 5(d) and 5(f) demonstrate artifacts to some extent, e.g., the brightness of three corns in Fig. 5(f) varies, due to the relatively large size of phantoms 2, 5 and 6, and insufficiently uniform radiation-area of MW. The last but not the least, due to the relatively low central frequency and limited bandwidth provided by the transducer, the resolution of TAI images is not high enough.
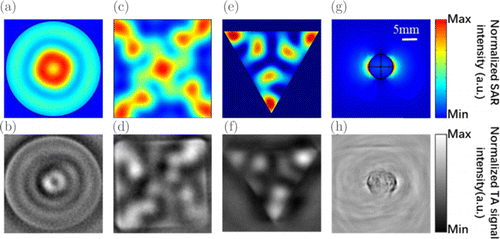
Fig. 5. Results from numerical calculations and TAI experiments for the SAR distribution in phantom 2 (a, b), phantom 5 (c, d), phantom 6 (e, f), biological tissue (g, h). Here, we take MW illumination with circular polarization for phantoms and linear polarization for biological tissue. Slices of SAR in phantoms 2, 5 and 6 at the fixed probing depths: z/l = 0.16. Note that (a), (c) and (e) are obtained from numerical calculations, while (b), (d) and (f) are obtained from TAI experiments. Under the illumination of MW with linear polarization that is x-oriented, the SAR distribution of a mouse subcutaneous tumor that embedded in porcine fat is numerically and experimentally demonstrated. (g) Simulation result and (h) TAI experimental result.
As a summary here, both the simulation and experimental results indicate that the artifact problem is sensitive to MW polarization. Contrast with conventional viewpoints,15,16 we point out artifacts cannot be eliminated under the illumination of circularly polarized MW. In fact, artifacts commonly exist in cylindrical targets, right-square and triangular prism targets, though they can be reduced in cylindrical targets due to the symmetry of the associated morphology.
To investigate the impact of the linear polarization on real biological tissue, we performed simulation and TA imaging experiment to the tumorous tissue embedded in porcine fat, as presented in Figs. 5(d) and 5(g), respectively. Before experiment, we cut porcine fat into a cuboid with a volume of 40 × 40 × 30mm3. Then we excised a mouse subcutaneous tumor with a diameter of approximately 10mm and embedded it inside the fat at a depth of 15mm. The image artifacts caused by the polarization can be found at two edges of the tumor. In addition, due to the fact that the porcine fat is not an ideal homogeneous medium, the SAR distribution in it is not homogeneously distributed.
In a more realistic situation, where much more complicated samples are involved, we point out that the simple structured phantoms as shown in this paper can provide a rough suggestion for selections of MW frequency and polarization, according to the type, morphology, size and orientation of tissues, e.g., breast cancer,35,36,37,38,39 finger joints40 and meat samples.41 Additionally, since the geometrical and electromagnetic parameters of tissues are known, the SAR distribution in the tissue is predictable. As a result, the artifacts that originated from the interaction of MW and tissue can be primarily distinguished and segmented, the quality of TA images can be further improved. Hence, to improve the image quality of TAI, this study could offer a better optimization in selecting the frequency and polarization of MWs regarding the interacted background tissues.
4. Conclusions
In conclusion, we show the feasibility of mapping SAR distribution of exposed electromagnetic field via TAI. Phantoms interact with incident microwave to produce Mie-like or Fabry–Perot-like SAR distribution pattern. This leads to the existence of the image-splitting in the linear and circular polarizations, as evidenced by numerical FEM simulations as well as TAI experiments. The strong dependence of SAR distribution pattern on the geometrical factors including shape, thickness, radius or side length, and polarization condition of the incident wave, indicates that image artifact commonly exists in TAI experiments, even though the antenna is designed to produce homogeneous illumination to the target. To effectively discover and locate the region of lesion, it may be desirable to introduce deep learning or artificial intelligence to capture the complicated SAR distribution pattern of a lesion with an arbitrary shape and size. Moreover, and more importantly, TAI has unambiguously demonstrated the capability of noninvasively mapping the distribution of SAR inside the target. In summary, the purpose of our study is to provide the guidance to predict and distinguish the artifact in TAI. Through numerical calculations and analysis to the SAR patterns of several phantoms and the tumor lesion in biological background, the proposed mapping method is of important application values for analyzing image artifacts in biomedical thermoacoustic imaging.
Acknowledgments
This study was supported by the National Natural Science Foundation of China (Nos. 62022037, 61775028, 81571722, 61528401 and 61921002), Guangdong province (2019ZT08Y191), Shenzhen Science and Technology Program (KQTD20190929172743294) and Startup grant from Southern University of Science and Technology. X. Liang and Q. Liu contributed equally to this work.
Conflicts of Interest
The authors declare that there are no conflicts of interest relevant to this article.
Data Availability Statement
The data that support the findings of this study are available from the corresponding author upon reasonable request.

