Automated retinal layer segmentation in optical coherence tomography images with intraretinal fluid
Abstract
We propose a novel retinal layer segmentation method to accurately segment 10 retinal layers in optical coherence tomography (OCT) images with intraretinal fluid. The method used a fan filter to enhance the linear information pertaining to retinal boundaries in an OCT image by reducing the effect of vessel shadows and fluid regions. A random forest classifier was employed to predict the location of the boundaries. Two novel methods of boundary redirection (SR) and similarity correction (SC) were combined to carry out boundary tracking and thereby accurately locate retinal layer boundaries. Experiments were performed on healthy controls and subjects with diabetic macular edema (DME). The proposed method required an average of 415s for healthy controls and of 482s for subjects with DME and achieved high accuracy for both groups of subjects. The proposed method requires a shorter running time than previous methods and also provides high accuracy. Thus, the proposed method may be a better choice for small training datasets.
1. Introduction
The accurate segmentation of retinal layer boundaries in retinal images is a critical process for pathological analysis and diagnosis. However, the images of the retinal layers are sometimes complex and difficult to segment. For example, diabetes mellitus may lead to macular edema (ME).1 In the optical coherence tomography (OCT) images of a retina affected by ME, a fluid-filled area can be seen; this area has low reflectance intensity and is a low contrast region in retinal tissue.2 The fluid-filled area distorts the retinal tissue, which may cause a segmentation algorithm to fail.
So far, researchers have proposed a number of methods for retinal segmentation. Some methods are based on graph theory and dynamic programming.3,4,5 Others are based on machine learning, such as pixel-wise classifiers.6,7 Further, neural-network-based methods,8,9,10,11 active contour methods, and level-set-based methods12,13,14,15 have also been proposed. These methods exhibit good performance in segmenting images of healthy eyes, some of which have performed well even in cases involving retinopathy. Kugelman et al.’s8 and de Sisternes et al.’s9 methods can be used for eyes affected by age-related macular degeneration, whereas those of Vermeer et al.6 and Zang et al.11 can be used to segment images of retinae affected by glaucoma. The methods of Lang et al.,7 Carass et al.,14 and Liu et al.16 have high accuracy in cases involving multiple sclerosis.17 These methods can handle some pathological eyes but not those affected by retinal fluid accumulation. Novosel et al.’s method15 can segment images of fluid-filled retinae affected by central serous chorioretinopathy.18 However, it is unclear whether the method can handle images of retinae affected by ME. In the eyes with retinal fluid accumulation, Wu et al. detected subretinal effusion,27 Sappa et al.28 and Hassan et al.29 segmented and classified the retinal fluid accumulation. Wei and Peng,30 Liu et al.,31 and Montuoro et al.32 segmented the retinal layer while separating the retinal fluid accumulation, achieving good results. But they rely on convolutional neural networks or unsupervised methods, which require a long time of training. Guo et al.’s method10 considered diabetic retinopathy, including ME, but the study did not cover the segmentation of a fluid-filled area because the structure of such an area is different from that of a healthy retina. In the dataset considered in this study, ME and microcystic ME sometimes appear simultaneously; hence, a segmentation method for images showing retinal fluid damage is needed.
Here, we propose a method to segment the retinal layer boundaries in OCT images with retinal fluid damage. Considering the structure of the retinal fluid region, fan filtering19,20 and gamma correction were employed to enhance the linear information pertaining to the boundaries in retinal images. A random forest (RF) classifier.21 was used to predict the boundary probability for each pixel. The classifier used multiple decision trees to learn the retinal features and make predictions. In the final segmentation, boundary redirection (BR) and similarity correction (SC) were used to refine the predicted boundary. The proposed method segmented images of healthy and fluid-filled retinae found in our dataset into 11 boundaries (10 layers). The names (abbreviations) of these 11 boundaries are: (1) inner limiting membrane (ILM), (2) nerve fiber layer–ganglion cell layer (NFL–GCL), (3) ganglion cell layer–inner plexiform layer (GCL–IPL), (4) inner plexiform layer–inner nuclear layer (IPL–INL), (5) inner nuclear layer–outer plexiform layer (INL–OPL), (6) outer plexiform layer–outer nuclear layer (OPL–ONL), (7) external limiting membrane (ELM), (8) myoid zone–ellipsoid zone (MZ–EZ), (9) ellipsoid zone–outer segment layer (EZ–OSL), (10) outer segment layer–retinal pigment epithelium (OSL–RPE), and (11) Bruch’s membrane (BM).
2. Materials and Methods
2.1. Data acquisition
All the participants provided informed written consent. The study was conducted according to the Declaration of Helsinki. The protocol was reviewed and approved by the ethics committee. In this study, 52 OCT volume scans were acquired from one eye of 52 participants (including 40 healthy controls and 12 subjects with eyes containing intraretinal fluid; age range: 18–50 years) using a commercial OCT system (Topcon 3D OCT-1). Each volumetric data element consisted of 128 B-scans, each B-scan was composed of 512 A-lines, and each A-line included 885 sampling points. The volumetric scan captured retinal reflectance signals with a field-of-view size of 6×6×2.36×6×2.3mm3 at the central macula region.
2.2. Preprocessing
Preprocessing consisted of two steps: filtering and flattening. In the filtering step, each B-scan was filtered by a fan filter with a passband angle θ=30∘θ=30∘ to enhance the interlayer texture information.20 Then, gamma correction was employed to enhance the image contrast. In the flattening step, which was the final process, the retinal boundaries were treated such that they were easier to find.
2.2.1. Fan filtering
The proposed approach used fan filtering, which can improve the interlayer texture information pertaining to the retinal image. A fan filter19,20 is a frequency-domain filter, which was first used in seismic data processing. The fan filter has two common passband versions: horizontal and vertical passbands [Figs. 1(a) and 1(b)]. The gray area value is 1, and the white area value is 0. It can maintain directional information in a range by adjusting the passband angle θθ. As shown in Fig. 1(c), we tested the gradient enhancement effect of θθ sector filter at 15–45∘ (spacing of 5∘), and its value first increased and then decreased. It has the maximum effect at 30∘. The retina is mostly distributed horizontally. In order to improve the vertical contrast between different retinal layers, the retinal layer can be better segmented. A fan filter with a vertical passband was used in our method. In the frequency domain, the fan filter’s passband HH is defined by
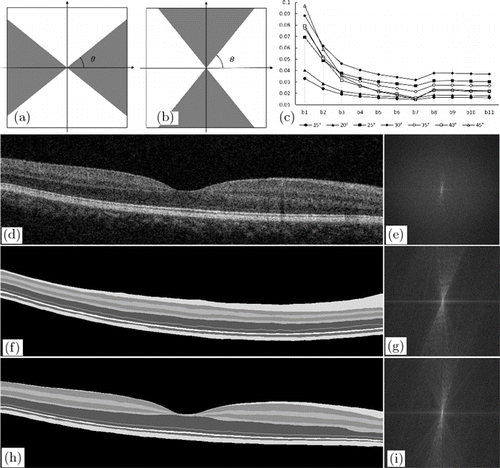
Fig. 1. Example of fan filter. (a) Vertical passband of fan filter. (b) Horizontal passband of fan filter. The gray area has a value of 1, and the white area has a value of 0. (c) Average signal vertical gradient on boundary through θ sector filter at 15–45∘. (d), (e) Real retinal image and the corresponding frequency-domain image. (f)–(i) Simulated retinal images and the corresponding frequency-domain images.
2.2.2. Flattening
Flattening can shift most of the boundaries to horizontal, making them easier to be tracked. ILM and BM are used in flattening, as they have large boundary gradients (Fig. 4) and are easy to be found. Besides, the region of interest is between these two boundaries. In order to find the ILM and BM layers, we first performed fan filtering and gamma correction on each original B-scan to enhance the gradient and contrast of the original image and obtain the longitudinal gradient, as shown in Figs. 2(a) and 2(b). After Sobel filtering, it can be clearly found that the first three highest longitudinal gradient layers are ILM layer, MZ–EZ, and BM layer (Fig. 4). Therefore, the ILM layer is first found; the threshold interval is set according to the ILM boundary to shield the area. Then MZ–EZ is found, and finally, the BM layer is determined. Points that diverge from boundaries are removed due to noise and other factors. We use nearest-neighbor interpolation to complement these points on boundaries, and finally use Gaussian filter to smooth the ILM and BM boundary.

Fig. 2. Retinal images flattening. (a), (b) B-scans after fan filtering and gamma correction with two retinal boundaries: ILM (yellow) and BM (red). (c), (d) The corresponding flattened images of panels (a) and (b), respectively.
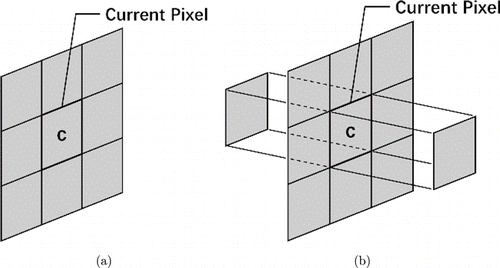
Fig. 3. Neighborhood features for (a) healthy retina and (b) retina with fluid.
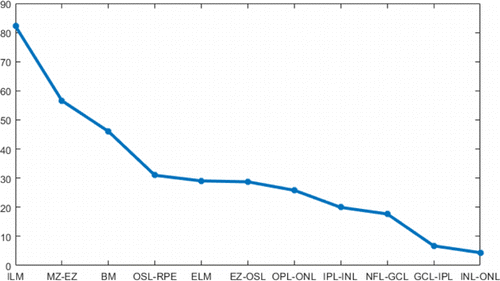
Fig. 4. Curve of boundary gradients on the original image: X-axis is boundary name and Y-axis is pixel intensity value.
After obtaining the BM boundary, we calculate the offset distance between the BM layer and the central position of the image (at 885/2 pixels). Then the pixels between ILM and BM move the offset distance to the center position, which realizes retinal flattening at the central region of the image by the flattening operation, as shown in Figs. 2(c) and 2(d). It should be noted that the operations such as fan filtering and gamma correction made in Fig. 2 are only for better finding the ILM and BM layers and better flatness of the original image. Since the intensity of each B-scan is uniform, it may affect the segmentation results of the retinal boundaries. Therefore, the intensity of each B-scan should be normalized. The normalization method is max–min normalization, and the formula is as follows :
2.3. Training and prediction
An RF classifier was trained to predict the retinal layer boundaries. To build the training dataset, 12 B-scans (six in the foveal region and six in the perifoveal region) were randomly selected from five subjects. The ground truth of the 11 retinal layer boundaries was manually labeled by experts.
In this study, 31 features were provided for RF classifier training7; these features helped the classifier to learn contextual, gradient, and position information pertaining to each class itself and the relationships between different classes. The details of the features are listed in Table 1. In particular, features 14–25 are generated by Gaussian anisotropy filtering. The filtering kernel is the full combination of three directions (−10∘, 0∘, 10∘) and two pixel scales σ(x1, y1)=(5,1) and σ(x2,y2)=(10,2). Features 12–25 are all made using the entire image.
| Nos. | Name |
|---|---|
| 1–11 | Neighborhoods of current pixel: 3×3 neighborhoods of current pixel, forward and backward pixels in nearby B-scans [Fig. 3(b)]. |
| 12, 13 | First and second vertical derivations of fan filtering image for the entire image. |
| 14–25 | First and second vertical derivations of two scales and three directions for Gaussian anisotropy filtering in the entire image. |
| 26–28 | Distance of each pixel to fovea in three dimensions. |
| 29–31 | The final context-aware features are the average vertical gradients in a 11×11 neighborhood located at 18, 28, and 38 pixels below the current pixel, calculated using a Sobel kernel.7 |
In total, 31 features were used to train the RF classifier; a part of the features were set by referring to Lang et al.’s method.7 Because the retinal fluid cases had more complex structures than the healthy control cases, 27 features were sufficient for the healthy controls, whereas all the 31 features were required for the retinal fluid cases to achieve better accuracy. To identity healthy controls and subjects with eyes containing retinal fluid, a thickness threshold Tm=370μm was defined based on our retinal dataset. The neighborhood features for the healthy retina are shown in Fig. 3(a). Gradient features 12 and 13, which were used in the retinal fluid cases, were not used in the healthy control cases.
After training, the RF classifier can learn the features of the pixels from the training set. Accordingly, the RF classifier can predict the probability of the retinal layer boundaries in each pixel. Then, the retinal layer boundaries can be generated using probability maps [Fig. 3(b)].
2.4. Obtaining accurate retinal layer boundaries from probability maps
Each probability map records the probability of the corresponding boundary but not the exact position of each boundary. To track the boundary from the probability map, we used the combination of the BR and SC methods. These two methods are designed for different kinds of boundaries, and they exhibit good performance and strong robustness for the images of both healthy control and retinal fluid cases.
The proposed BR and SC methods both use nonmaximal suppression (NMS) and hysteresis thresholding in boundary tracking. NMS is used to determine the point with the maximum probability in each A-scan, and these points are divided into strong and weak boundary points. Hysteresis thresholding is used to keep the strong and weak boundary points attached to strong boundary points. When the boundary meets an intraretinal fluid region, the boundary probabilities are usually small, so the threshold for these kinds of boundaries also needs to be small.
The tracking of boundaries in a specific order is helpful to increase accuracy. In this study, the tracking order was chosen to be from the most reliable boundaries to the unreliable boundaries. The gradient curve of each boundary for retinal layers is shown in Fig. 4. It can be seen that the ILM layer, MZ–EZ, and BM layer have higher gradients, so they are considered as the reliable boundaries. First, these three boundaries are tracked, and then these three boundaries are used as restricted areas to delineate the other layers. The boundary tracking order is as follows: ILM, BM, MZ–EZ, EZ–OSL, OSL–RPE, ELM, NFL–GCL, GCL–IPL, INL–OPL, IPL–INL, and OPL–ONL.
For the BR and SC methods, the searching region settings in the same boundary were sometimes inconsistent because the thickness of a layer in each A-scan was not the same. Therefore, it was necessary to consider the thickness of each layer. We randomly chose 30 volumes from the dataset and segmented the retinal layers. Finally, the interval distance between the boundaries was calculated as the evidence for the searching region setting.
2.4.1. BR method
The BR method was used for tracking the boundary with a small curvature and a high prediction probability. This kind of boundary is common and easy to track, but problems still occur when mistaken predictions are carried out [Fig. 5(c)]. First, the BR method was used to obtain the preliminary boundary using NMS,22,23 the probability map was then converted into a binary map through hysteresis threshold, and the cubic spline function was used to fit the binary map to obtain the fitted curve. Then, a new searching region was selected by choosing a region with a width of 5–10 pixels above and below the fitted curve in the first step, and the boundary was tracked again in the searching region. The result of the second round of tracking was considered as the final boundary. An example of the BR method is shown in Fig. 5. By using the BR method, the misjudgment [Fig. 5(c)] in the vessel shadow region can be corrected [Fig. 5(f)], as shown in the example.

Fig. 5. Example of BR method. (a) Retinal images with vessel shadow. (b) Probability map predicted by the RF classifier. The magenta lines indicate the boundary found in panel (b) using NMS, and the red line in panel (d) indicates the fitted line of the magenta line in panel (c). (e) Searching region. (f) Final predicted boundary (magenta line).
2.4.2. SC method
The SC method is usually used for boundaries with a large curvature and a low prediction probability (e.g., NFL–GCL). These boundaries are difficult to track using the BR method. Thus, for these boundaries, boundary similarity (the shape of these boundaries is similar to the neighborhood boundaries) is the main factor to be considered in the searching region setting. For example, in B-scans near the fovea, NFL–GCL’s searching region is set by the ILM because it is the boundary above NFL–GCL. The ILM is the first tracked boundary in these 11 boundaries. Examples of using the SC method in the images of the retinal fluid cases are shown in Fig. 6.

Fig. 6. Examples of SC method in images of retinal fluid case. (a), (d) Probability maps of OPL–ONL and INL–OPL, respectively. The red regions in panels (b) and (e) represent the searching regions of boundaries. In panel (b), the top and bottom magenta lines are the tracked boundaries of the ILM and ELM. (e) The magenta lines represent tracked boundaries: IPL–INL and OPL–ONL and the red region was used to restrict the searching space. The magenta lines in panels (c) and (f) are the final boundaries for OPL–ONL and INL–OPL, respectively. (g) Final tracked boundaries of INL–OPL and OPL–ONL in the image of the retinal fluid case. (h) Smoothed boundaries.
3. Results
3.1. Algorithm performance
A large blood vessel in the superficial layer can produce hyper-reflection artifacts and strong shadow artifacts in the superficial and deep layers, respectively. These artifacts may cause the segmentation algorithm to fail; thus, we use fan filtering to eliminate these artifacts. Figure 7(b) shows the result of using a fan filter on the image in Fig. 7(a) with θ=30∘. As shown in Fig. 7(b), the fan filter can suppress the hyper-reflection area and compensate for the shadow region (Fig. 7d). The width of the vessel shadow area can be well compensated by adjusting the passband angle of the fan filter. The larger the angle, the wider is the area from which the vessel shadow can be removed. In addition, gamma correction is used to enhance the contrast of the gradient on the layer boundaries.
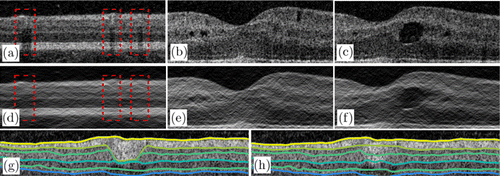
Fig. 7. Results of the proposed filter. (a) Original image of healthy retina and (d) image filtered by the fan filter. The regions marked by red rectangles are large vessel regions. (b), (c) Retinal images with pseudocysts and edema. (e), (f) Filtered images of panels (b) and (c), respectively. (g) Retinal layer segmentation result without searching region setting. (h) Result obtained using the proposed method, which is better than the result in panel (g).
For pathological cases, the fan filter can maintain the consistency of the boundaries in the lateral direction. The fan filter can also suppress the effect of pseudocysts and reduce the gradient level of the edema boundary in the lateral direction [Figs. 7(c) and 7(f)]. In general, the proposed filter can smooth the retinal image and reduce the gradient level in the lateral direction. The fan filter can further weaken partially discontinuous noise points and preserve the consistency of the layer boundaries. Moreover, the gradient on the retinal boundaries is enhanced by the fan filter.
The proposed boundary tracking method also shows good performance because the layer thickness provides more evidence about the searching region setting. In the large vessel shadow region, the segmentation usually fails [Fig. 7(g)] and the prediction is strongly influenced by the blood vessel. By adding the searching region, our algorithm can generate correct segmentation, as shown in Fig. 7(h). Furthermore, our method shows good results in boundaries affected by the retinal fluid region, as shown in Fig. 6.
3.2. Validation results
To validate the segmentation accuracy of the proposed method, we quantified the average errors between the manually delineated ground truth and auto-segmented results in the testing set, which included 40 healthy controls and 12 subjects with eyes containing intraretinal fluid. The comparison results are listed in Table 2. There is no statistically significant difference between the absolute errors of two groups, indicating that our classifier can accurately predict the location of retinal boundary of healthy control and subjects with diabetic macular edema (DME).
| Boundary | Absolute errors (μm) | |
|---|---|---|
| Healthy | With intraretinal fluid | |
| ILM | 1.57 | 1.54 |
| NFL–GCL | 2.77 | 2.84 |
| GCL–IPL | 5.22 | 5.14 |
| IPL–INL | 3.94 | 4.55 |
| INL–OPL | 3.11 | 3.77 |
| OPL–ONL | 5.05 | 4.99 |
| ELM | 2.37 | 2.04 |
| MZ–EZ | 1.23 | 1.95 |
| EZ–OSL | 1.78 | 1.57 |
| OSL–RPE | 3.93 | 2.95 |
| BM | 2.52 | 2.97 |
4. Discussion
In this paper, we proposed an auto-segmentation algorithm for retinal layer segmentation. The algorithm consisted of a novel filtering method to smooth the retinal volume and a new boundary tracking method. The proposed method can segment 10 retinal layers in the images of both healthy eyes and eyes with intraretinal fluid.
Filters such as the average filter and adaptive-weighted bilateral filter24 were used for preprocessing. However, these filters cannot eliminate vessel shadow artifacts, which can cause the segmentation to fail. The fan filter can smooth the image by setting the passband angle, which corresponds to the linear features in a direction range. Compared with other filters, the fan filter is more effective in suppressing most vessel shadow artifacts. The average signed vertical gradient on the boundary obtained between the images filtered by the fan filter with different θ values and the original images [Fig. 2(c)] shows that in most cases, the boundary gradient in the filtered images is better than that in the original images. When the angle is set at 30∘, the gradient of the layer boundaries in the fan-filtered image reaches a relatively high level.
In recent years, researchers have proposed numerous algorithms to segment retinal layers.3,8,10,16,25,26 The pixel classification method is more reliable than the gradient method because the former method considers not only the gradient but also other features such as the context and location. The gradient might be the most critical information in retinal layer segmentation, and some algorithms mainly rely on the gradient information to segment retinal layer boundaries.3 However, the role of the gradient is also important on the boundary of the fluid region, which may cause errors in segmentation. Recently, neural-network-based methods have become popular, and, according to several studies, their performance is better than those of other methods.16,26 Compared with the neural network, the RF classifier is more controllable because the features can be selected manually. In addition, the RF classifier shows better performance than other kinds of classifiers,7 and hence, we chose the RF classifier in this study.
For boundary tracking, many algorithms have been used to handle probability maps, such as Lang et al.’s Canny and graph-based searching (GS) methods,7 Carass et al.’s multiple-object geometric deformable model method,14 and Liu et al.’s layer boundary evolution method.16 Compared to Lang et al.’s Canny method, their GS method has better accuracy but also requires greater computation time. Methods of Carass et al. and Liu et al. are both based on the level set method, which requires a higher computation capability for complex algorithms. Compared with other methods, the method proposed in this study has a lower computation complexity, so it needs a shorter running time. Additionally, it has a high accuracy because of searching region setting in the tracking stage. Thus, the proposed method may be a better solution for small training datasets. Although the searching region setting enables the algorithm to eliminate the influence of error prediction, it still requires prior knowledge about the dataset. Considering the heavy workload involved in manual segmentation, the thickness calculation required for the searching region setting can be realized through auto-segmentation and manual correction. The limitation of the proposed method is the lack of samples with a large retinal fluid size. Therefore, the performance of the proposed method may not be good for samples with a large amount of retinal fluid. In the future, the neural network will be considered to enhance segmentation accuracy, and the retinal fluid region will be segmented and analyzed to assist in diagnosis.
Conflict of Interest
The authors declare no conflict of interest.
Acknowledgments
This work was supported by Grants from the Research and Development Projects in Key Areas of Guangdong Province (2020B1111040001), the National Natural Science Foundation of China (NSFC) (81601534, 62075042, and 61805038), and Guangdong-Hong Kong-Macao Intelligent Micro-Nano Optoelectronic Technology Joint Laboratory (2020B1212030010).

