Spatiotemporal Dynamics of an Intraguild Predation Model with Intraspecies Competition
Abstract
Different species in the environment compete with one another for shared resources and suitable habitats. As a result, it becomes crucial to identify the essential components involved in preserving biodiversity. This paper describes the emergence of a wide range of temporal and spatiotemporal dynamics of an intraguild predation (IGP) model with intraspecies competition and Holling type-II response function between the IG-prey and IG-predator. To explore the dynamics of the temporal model, we study the local stability of all the biologically feasible steady states, global stability of the interior steady state, and Hopf bifurcation. Performing partial rank correlation coefficient (PRCC) sensitivity analysis, we picked more sensitive parameters and plotted the stability regions in two-parameter spaces. The dynamics exhibited by the system can demonstrate some important hallmarks noticed in the environments, such as the existence and nonexistence of oscillatory behavior in the IGP model. The analytical formulations for the stability and bifurcation of the coexistence of the steady-state are not easy to obtain, but we have verified numerically that the limit cycle bifurcates from the coexistence of the steady-state and there eventually emerges a chaotic behavior through period-doubling bifurcations. By plotting the largest Lyapunov exponent (LLE), we have verified that the temporal system experiences chaotic behavior. It is demonstrated that in the case of a diffusive system, diffusion may cause the coexistence of the steady state, which is otherwise stable, to become unstable. Criteria for the occurrence of Turing instability connected to the IGP model are derived. Our numerical illustrations demonstrate that diffusion-driven instability develops different stationary patterns based on the different initial conditions and diffusion parameters. The spatiotemporal patterns are observed in the Turing, Hopf–Turing, and Hopf regions.
1. Introduction
Intraguild predation (IGP) is a type of omnivorous food web in which predation and competition coexist. Two populations compete for the same food (basal resource), and one of the species among them is IG-predator that consumes the other called IG-prey [Holt & Polis, 1997]. Such types of ecological interactions are theoretically anticipated to have a lower potential for stability, leading to the extinction of both the populations [Holt & Polis, 1997]. Regardless, IGP is ubiquitous and this common interplay can be observed in nature [Amarasekare, 2007; Han et al., 2017; Han et al., 2019; Kang & Wedekin, 2013]. There are various biological factors promoting the resilience of the ecological model, like the defense caused by the existence of IG-predator. Experiments and observations revealed a variety of dynamical mechanisms in food webs with inducible defenses [Kratina et al., 2010].
The food habit of the large mammalian carnivore is fascinating as the larger carnivores like lions and gray wolves kill the smaller species such as foxes for their food; besides this food, they also kill other species from the group of herbivores like cow, goat, deer, etc. Also, the small carnivore animals collect their energy from the herbivore group. This special type of food interaction forms an example of IGP in terrestrial ecosystems. Lion–fox–deer interaction is a particular example of IGP in the terrestrial ecosystem. In aquatic ecosystems, basking sharks and toothed whales are examples of IG-predators with the small fishes as IG-prey and zooplankton as shared resources. Also, we have the existence of IGP in freshwater ecosystems as many big fishes eat small fishes besides eating the insect larvae. Planktivorous–cladocerans–phytoplankton interaction is another example of an aquatic IGP. Since IGP is very frequent in nature, it is very important to analyze its dynamics. To understand the coexistence of predator and prey species as well as the impact of numerous causes contributing to complicated dynamics and the extinction of one or more species, multispecies population models with a variety of interplays are essential.
Survival of all species in the environment is challenging because of the change in nature. So, the researcher’s objective is to discover a circumstance in which environmental stability is achievable to preserve biodiversity. Intraspecies competition is a significant determinant in the growth of a species. IGP is an example of gaining advantage by consuming possible competitor. Kang and Wedekin [2013] studied an IGP system with two types of IG-predators, namely generalist and specialist, but did not address the Holling type-II interaction between possible rivals (IG-prey and IG-predator) for common food. The dynamics of the IGP system with Holling type-II response function, intraspecies competition, and logistic growth in shared resource population attracted the researchers due to the complicated interactions among the species.
Previously in the study of ecological systems, directly affecting factors had been considered to form ecological models. But with the progression of time, various factors (intraspecies competition, fear, group defense, delay, Allee, etc.) were found to affect ecological interactions and had been applied in the study of ecological modeling [Li & Dai, 2019; Dash & Khajanchi, 2023; Hossain et al., 2020; Sarkar & Khajanchi, 2020, 2022; Sun, 2016; Garay, 2009]. Ecologists have explored the importance of IGP by providing rich dynamics related to it in a variety of habitats [Amarasekare, 2007; Verdy, 2010; Mendonça et al., 2020; Hart, 2002]. A general form of IGP system was studied by [Li & Dai, 2019] to emphasize the effects of intraspecies competition. The study focused on the impact of intraspecies competition for increasing dynamical complexity on intraguild system with a detailed analysis containing linear functional responses. The authors did not recognize the Holling type-II functional response for IG-prey. Mendonça et al. [2020] used the notion of foraging to the IGP model in order to make it more consistent with nature. Tanabe and Namba [2005] formed and analyzed a basic IGP system with type-I response function among the three species. The authors numerically demonstrated that their model exhibited chaotic oscillatory behavior. Holt and Polis [1997] proposed a general model describing IGP system and studied it from a theoretical point of view. Kang and Wedekin [2013] analyzed the IGP model by considering Holling type-III response function between the intermediate prey and IG-predator. They had not considered the intraspecies competitions in both IG-prey and IG-predator populations.
The interest for studying the dynamics of ecological system with dispersal among the species has increased progressively. After the innovative work of [Turing, 1990] in chemical morphogenesis, the generation of spatiotemporal patterns owing to the reaction–diffusion equation for prey–predator interactions has attracted researchers’ attention. There are a large number of existing works about the spatiotemporal pattern formation on two- and three-dimensional ecosystems by considering the reaction–diffusion equations [Sarkar & Khajanchi, 2023; Baurmann et al., 2007; Weide Rodrigues et al., 2019]. Sarkar and Khajanchi [2023] used the impact of fear on an ecological model and analyzed the corresponding spatial model with two-dimensional reaction–diffusion system and observed some interesting Turing and non-Turing patterns. Without specifying any particular response function, Baurmann et al. [2007] determined the requirements of Hopf and Turing instabilities for a two-dimensional predator–prey system. In a two-species prey–predator model, the conditions for Turing and Turing–Hopf patterns had been established by [Weide Rodrigues et al., 2019]. The authors derived the regions for Turing and Turing–Hopf patterns in a two-parameter space. The dynamics of a three-species spatiotemporal model is more interesting and complicated than that of a system with two species. Researchers studied the Turing patterns for two-dimensional system and they also studied the spatiotemporal dynamics for the three-dimensional systems like food chain model [Fu et al., 2021; Peng et al., 2007; Shivam Singh & Kumar, 2022], two prey–one predator system [Lv et al., 2013; Manna et al., 2020; Baghel & Dhar, 2014], and IGP [Han et al., 2017; Han et al., 2019; Han & Dai, 2016; Ji et al., 2022; Zhang & Dai, 2021]. The pattern formed by the species involved in IGP model is very interesting. Considering a diffusive IGP system with delay and type-II response function, Han and Dai [2016] studied and depicted interesting spatiotemporal patterns. Han et al. [2017] studied the pattern with a delayed IGP model by taking the Beddington–DeAngelis response function between the basal resource and IG-predator. A simple two prey–one predator model was examined by [Manna et al., 2020] with nonlocal effect. Also, the authors showed that their model exhibited chaotic behavior and depicted a special type of pattern in the boundary of Turing–Hopf curve. A simple IGP system with Holling type-I response function had been investigated by [Han et al., 2019] without recognizing the intraspecies competition. Considering the nonlocal interactions in shared resource population, they described a special type of pattern for their proposed model. The study showed that the nonlocal interaction is a key mechanism for the formation of Turing patterns in the intraguild system. As the competition between two individuals from the same species is very frequent in nature, we preferred to study IGP system considering intraspecies competition. The dynamics of IGP system with type-I response function at each interaction term had been analyzed by [Manna et al., 2021]. Introducing one-dimensional reaction–diffusion equations for each species, they formed a spatiotemporal model and showed the nonexistence of Turing patterns for a particular case. There are a large number of existing works describing the Turing and non-Turing patterns not only on the IGP but also on other ecological systems [Upadhyay et al., 2019; Guin & Mandal, 2014; Rao, 2013; Zhang et al., 2014; Huang et al., 2017]. Besides the research on spatiotemporal dynamics, many forms of functional responses have been introduced to better understand the predator–prey dynamics, such as the Monod–Haldane [Khajanchi, 2017], Beddington–DeAngelis [Khajanchi, 2014], and response functions [Sarkar et al., 2020; Mondol & Khajanchi, 2024], from diverse points of view.
The main goal of this study is to uncover the dynamics of an IGP model and look over the influence of random dispersals in the three-species system. To study the random dispersal of the involved species, we investigate the three-dimensional reaction–diffusion system and observe different types of spatiotemporal patterns. We find that the proposed IGP system shows highly periodic or chaotic behavior for the most sensitive parameters. To identify the sensitive parameters, we performed partial rank correlation coefficient (PRCC) sensitivity analysis. Also, to verify the chaotic behavior, we have plotted the largest Lyapunov exponent (LLE).
| Parameter | Ecological Explanation | Value | Dimension |
|---|---|---|---|
| αu | Maximum growth rate of basal resource | 5 | Time−1 |
| Ku | Carrying capacity of basal resource | 12.5 | No. per unit area |
| h | Half-saturation constant | 100 | No. per unit area |
| γu | Attacking rate of IG-predator on shared resource | 35 | [No. per unit area]−1 Time−1 |
| cv | Conversion efficiency of the IG-prey | 1 | Dimensionless |
| ηv | Maximum of IG-prey attacked by IG-predator | 100 | Time−1 |
| δv | Natural decay rate of IG-prey | 1 | Time−1 |
| ξv | Coefficient of competition between two individuals | 0.2 | [No. per unit area]−1 Time−1 |
| from IG-prey group | |||
| cw | Conversion efficiency of the IG-predator | 0.0029 | Dimensionless |
| βu | Predation rate of IG-prey on shared resource | 1 | [No. per unit area]−1 Time−1 |
| 𝜃w | Biomass conversion rate from intermediate prey to IG-predator | 1 | Dimensionless |
| ξw | Intraspecies competition between IG-predators | 0.3 | [No. per unit area]−1 Time−1 |
| δw | Natural decay rate of IG-predator | 1.4 | Time−1 |
This work consists of six important sections. In Sec. 2, we discuss the three-species IGP model. Analysis of the model has been performed in Sec. 3, including boundedness, uniform persistence, ecologically feasible steady states, and their local and global stability analyses. In the same section, we also perform the analysis of Hopf bifurcation. The diffusive terms have been introduced into the IGP model in Sec. 4 to form a system of partial differential equations with two independent variables. Extensive numerical simulations have been performed in Sec. 5 to support our theoretical outcomes and visualize the dynamics of the temporal and spatiotemporal systems. The results obtained from our study about the formulated model have been discussed in Sec. 6.
2. The Model
In order to better understand the natural processes, food web dynamics are often investigated through mathematical modeling. IGP is basically the conjunction of predation and competition in a sub-system with many species, the most rudimentary of which is a three-species sub-system. Here, we investigate the dynamics of IGP system, which is driven by type-II response function specified by the middle and the top species of the intraguild system [Holling, 1959]. Holt and Polis [1997] designed the IGP model by investigating the impacts of competition on IGP system and food chains to better understand the prey–predator interactions. The authors considered classical Lotka–Volterra model and integrated IGP into it. With the consideration of the biomass of basal resource U(t) (e.g. a type of unicellular algae Rhodomonas minuta), IG-prey V(t) (e.g. the hypotrich ciliates of genes Euplotes spp.), and IG-predator W(t) (e.g. the turbellarian flatworm Stenostomum virginianum), we study the IGP system and obtain the following system of differential equations :
3. Model Analysis
In this section, we examine the qualitative behavior of model (1) including uniform persistence, boundedness, equilibria, stability analysis, and the occurrence of Hopf bifurcation.
3.1. Qualitative properties
In our proposed model, all the interaction functions are continuous, having first derivatives in the nonnegative octant ℝ3+={(U,V,W)∈ℝ3:U≥0,V≥0,W≥0}. The positive invariance of Int(ℝ3+) is established by applying Nagumo’s theorem [Nagumo, 1942] to system (1). The boundedness of the solutions is given by the following theorem.
Theorem 1 [Dash & Khajanchi, 2023]. Every solution of (1) is bounded in the region F, where F={(U(t),V(t),W(t)):0≤U(t)≤a1,0≤V(t)≤a2,0≤W(t)≤a3} with a1=Ku, a2=cvβuKu−δvξv, and a3=cwγuKuh+𝜃wηva2−δwhhξw, provided βuKu>δvcv and δw<cwγuKu+𝜃wηv(cvβuKu−δv)hξv.
The proof is obvious.
Uniform persistence [Khajanchi & Banerjee, 2017]: System (1) is said to be uniformly persistent or permanent if there exist two positive constants Δ and δ independent of the initial conditions with 0<δ<Δ and satisfying
To collect the supporting evidence for the long-term behavior of system (1), the uniform persistence of the formulated model should be examined.
Theorem 2. If the parameters satisfy the following three conditions simultaneously, then system (1) shows uniform persistency. The three conditions are:
| (i) | αu≥βua2+γua3, | ||||
| (ii) | cvβuKuαuh≥cvβ2uha2+(cvβuγuh+ηvαu)a3+δvαuh, | ||||
| (iii) | cwγuKu≥δw+cwγuKuβua2+γua3αu. | ||||
Proof. To determine the lower bounds of the dependent variables, we write the first equation of (1) as
3.2. The equilibria
The ecologically feasible equilibrium points are obtained by solving the three equations ˜F=0, ˜G=0, and ˜H=0. Irrespective of the parameter values, the proposed model (1) possesses five biologically feasible steady states. There are four axial equilibrium points and one interior equilibrium point in ℝ3+:
| (1) | trivial steady-state E0(0,0,0); | ||||
| (2) | steady-state only with shared resource E1(Ku,0,0); | ||||
| (3) | IG-predator-free equilibrium point E2(U2,V2,0), where U2=Ku(αuξv+δvβu)cvβ2uKu+αuξv,V2=αu(−δv+βucvKu)cvβ2uKu+αuξv | ||||
| (4) | IG-prey-free equilibrium point E3(U3,0,W3), where U3=Ku(δwγu+αuξw)αuξw+γ2uKucwandW3=αu(γuKucw−δw)αuξw+γ2uKucw | ||||
| (5) | the coexisting steady-state E∗(U∗,V∗,W∗) with U∗=Ku(αu−βuV∗−γuW∗)αu,W∗=cvβu(Ku−βuKuV∗αu)−δv−ξvV∗ηvh+V∗+cvβuKuγuαu, h0V3+h1V2+h2V+h3=0,(2) h0=S6S8−S4S2,h1=S4S1−2hS4S2+S6S7−S5S8,h2=2hS4S1−h2S4S2−S5S7−hS3S8,h3=h2S4S1−hS3S7,S1=cvβuKu−δv,S2=ξv+cvβ2uKuαu,S3=cwγuKu−δw,S4=ξw+cwγ2uKuαu,S5=S3+𝜃wηv−hcwγuKuβuαu,S6=cwγuKuβuαu,S7=ηv+cvβuγuKuhαu,S8=cvβuγuKuαu. | ||||
3.3. Local stability analysis
To examine the local stability, we determine the Jacobian matrix J around any point E(U,V,W) of system (1), where
Theorem 3 [Dash & Khajanchi, 2023]. System (1) can never be locally asymptotically stable about the trivial steady-state E0(0,0,0).
Theorem 4 [Dash & Khajanchi, 2023]. Model (1) exhibits locally asymptotically stable behavior about the steady-state E1(Ku,0,0) if cvβuKu<δv and cwγuKu<δw.
Theorem 5. Model (1) becomes locally asymptotically stable about the IG-predator-free steady-state E2(U2,V2,0) if
Proof. The system is locally asymptotically stable around E2 if all eigenvalues of the corresponding Jacobian matrix are negative or have negative real parts. One of the eigenvalues of the Jacobian matrix is cwγuU2+𝜃wηvV2h+V2−δw and the remaining eigenvalues are the zeros of the characteristic polynomial of
Theorem 6. If the IG-prey-free steady-state exists, then model (1) is locally asymptotically stable about E3(U3,0,W3) if hcvβuKu(δwγu+αuξw)<ηvαu(γuKucw−δw)+hδv(αuξw+γ2uKucw) is satisfied.
Proof. An eigenvalue of the Jacobian matrix evaluated at E3(U3,0,W3) is cvβuU3−ηvW3h−δv and the remaining two are the zeros of the characteristic polynomial of
Theorem 7. The coexisting steady-state E∗(U∗,V∗,W∗) will become a stable steady-state for the IGP system (1) if the conditions Ã1>0, Ã3>0, and Ã1Ã2>Ã3 are satisfied simultaneously. The quantities Ã1,Ã2, and Ã3 are the coefficients of characteristic equation of the corresponding Jacobian matrix.
Proof. The variational matrix at the coexisting steady-state E∗(U∗,V∗,W∗) is
3.4. Global stability around coexisting steady state
In this sub-section, we study the global stability of (1) around the coexisting equilibrium point E∗(U∗,V∗,W∗) by formulating an appropriate Lyapunov function. To establish the requirements for global stability of the system about the interior equilibrium, we have availed the help of a proposition which has been given below.
Proposition 1 (Frobenius Method). Let XT=(x1,x2,x3,…,xn)∈Rn and A be an n×n symmetric matrix over R. If the real second-degree form XTAX is negative definite, then the matrix A will be negative definite. The matrix A will become negative definite if and only if its principal minors carry alternative signs, starting from the first-order minor with negative sign.
Theorem 8. The system becomes globally asymptotically stable about the coexisting steady-state E∗(U∗,V∗,W∗) if the following conditions are satisfied:
| • | h+b2>ηvW∗ξv(h+V∗), | ||||
| • | (h+b2)2(ξv−ηvW∗(h+b2)(h+V∗))>η2v(cv𝜃wh−cwh−cwV∗)2cvcwξw(h+V∗)2, | ||||
where b2 is defined in Theorem 2 to represent the lower bound of V(t).
Proof. We construct a positive definite functional
| (1) | h11<0, | ||||
| (2) | |h11h12h21h22|>0, | ||||
| (3) | determinant of H is negative. | ||||
Without losing the generality, we consider c2=1, c1=cv, and c3=cvcw which leads to h11<0. After evaluating the determinant of the matrix (hij)2×2, we get
3.5. Hopf bifurcation
This sub-section analytically establishes the conditions that are necessary and sufficient for the occurrence of Hopf bifurcation in (1) with reference to the attacking rate ηv. When ηv crosses a threshold value, the system changes its behavior and starts to exhibit periodic oscillations around the interior steady state. The occurrence of Hopf bifurcation for ηv is described by the following theorem.
Theorem 9. System (1) exhibits Hopf bifurcation about E∗ for ηv if and only if there exists ηv=η∗v satisfying the following conditions:
| (1) | Ãi(η∗v)>0, for i=1,2,3, | ||||
| (2) | Ã1(η∗v)Ã2(η∗v)−Ã3(η∗v)=0, | ||||
| (3) | ddηvRe(λi)|ηv=η∗v≠0, i=1,2. | ||||
Proof. Since all Ãi(ηv)>0 for ηv=η∗v, so there exists 𝜖i in such a manner that inside the interval (η∗v−𝜖i,η∗v+𝜖i), for i=1,2,3, all Ãi are positive. We take 𝜖=min{𝜖1,𝜖2,𝜖3}, therefore all Ãi(i=1,2,3) will take positive sign in the interval (η∗v−𝜖,η∗v+𝜖). Hence, there are no positive real roots of Eq. (3). For ηv=η∗v, we have
4. The Spatial System
With the assumption that predator and prey densities are not spatially dependent and dispersion of either population is not taken into account, the predator–prey models within homogeneous environments are capable of representing the change in population density due to predation. In reality, prey and predator populations are heterogeneously distributed across the natural environment, and population movements are caused by the abundance of population densities. When the mobility of both the prey and predator populations within a bounded environment is considered, the governing model system (1) can be modified as the following system of partial differential equations :
4.1. Dynamics of spatial system: Turing instability
For a better understanding of the dynamics of spatiotemporal model (6), we have linearized the proposed system about the coexistence equilibrium (U∗,V∗,W∗) with small perturbations
where
The function attains its minimum value at
| • | ; | ||||
| • | and . | ||||
As a result, the Turing bifurcation border can be defined as
5. Numerical Simulation
In this section, we provide extensive numerical illustrations to encapsulate our analytical conclusions and to analyze the spatiotemporal pattern development caused by IG-predator diffusion. The Runge–Kutta method is used to numerically solve the system of nonlinear ordinary differential equations (1) under various sets of system parameters and initial conditions. The used parameter values are listed in Table 1.
5.1. Sensitivity analysis
The IGP model (1) is studied theoretically as well as numerically and the parameters are considered from various sources and experimental data. By utilizing the PRCC procedure, a sensitivity analysis has been performed to identify how the IGP model outcome is influenced by altering a particular parameter regardless of the uncertainty of system parameters. The system has 13 parameters and we alter all the system parameters consequently. For the PRCC analysis, the PRCC values have been taken from the range . Using the technique established by [Marino et al., 2008], we used Latin hypercube sampling and created 1800 samples to calculate the PRCCs and p-values for the IG-prey for five separate points to find out the sensitive parameters. The indexes are calculated at the following points: 50, 75, 100, 125, and 150 days. Figure 1 describes the PRCC outcomes, implying the system parameters namely the attacking rate (), half-saturation constant (h), biomass conversion rate from IG-prey to IG-predator (), and natural decay rate of IG-predator () account for most uncertainty of the IG-predators.
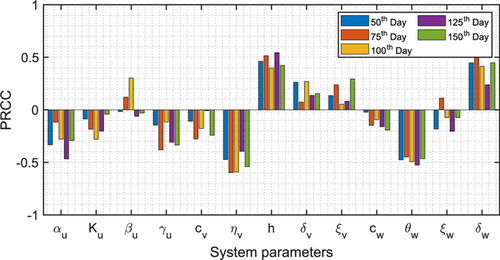
Fig. 1. PRCCs for the system parameters of (1) for different times with .
5.2. Local stability of equilibria
At first, we integrated the temporal system (1) and plotted the time series evolution of basal resource, IG-prey, and IG-predator populations. We explored this study to better understand the complicated dynamics of IGP. We observed time series evolution of (1) for the parameter values listed in Table 1 with the initial population sizes , , and . Time series evolutions of (1) are shown in Fig. 2 for different values of . First row of Fig. 2 shows the kinetics of shared resource , second row shows the kinetics of IG-prey population, third row shows the kinetics IG-predator population, and the fourth row shows the three-dimensional phase portraits. Figures 2(a), 2(e), 2(i), and 2(m) are shown for with the interior steady-state and the corresponding eigenvalues
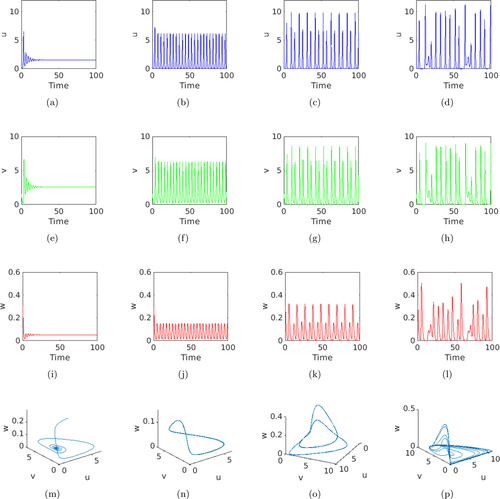
Fig. 2. The figure shows the phase diagrams and the time series evolutions of model (1) for distinct values of . First column [panels (a), (e), (i), and (m)] is for , second column [panels (b), (f), (j), and (n)] is for , third column [panels (c), (g), (k), and (o)] is for , and fourth column [panels (d), (h), (l), and (p)] is for , and the other parameters are fixed according to Table 1. The first column supports the fact that system (1) shows locally asymptotically stable behavior near the interior steady state. The second column shows periodic oscillation about the coexisting steady state. The third column confirms the two periodic solutions around the coexisting equilibrium point. The fourth column shows the chaotic solution of system (1).
Figures 2(b), 2(f), 2(j), and 2(n) are plotted for with the coexistence steady-state . The coefficients of the characteristic polynomial (3) are
To fully comprehend the effects of the system parameters on the dynamics of (1), the stability regions in different parameter spaces are plotted in Fig. 3. Stability regions help identify under what parameter values the proposed system shows stable, unstable, as well as limit cycle oscillating behaviors. We have used red, blue, magenta, and yellow colors to identify the stable region, unstable region, and oscillatory region for different equilibrium points. It can be observed that the parameter spaces – and – show more variations in the stability of the system. From Fig. 3(a), it can be observed that if we increase the decay rates of IG-prey and IG-predator populations, the unstable region reduces and finally vanishes, as shown in the yellow-colored portion. In this yellow-colored region, the system shows limit cycle oscillations. The red-shaded region represents the extinction of the IG-predator population, where the values of are high enough, which is expected as higher decay rates are deleterious for the IG-predator. The blue-colored region describes the disappearance of IG-prey population in which the magnitude of is sufficiently large, which is natural as larger values for are deleterious for the IG-prey population. The magenta-colored region delineates the scenario in which all the three populations exist together, which is the most biologically relevant region as all the three species are locally asymptotically stable in this region. Similarly, we can explore the stability region [see Fig. 3(b)] for the parameter space –.
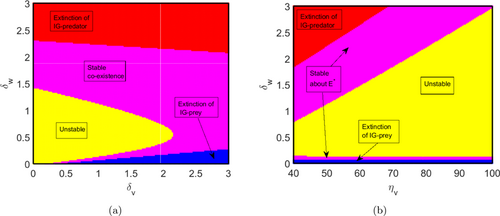
Fig. 3. Stability regions for the ecologically feasible equilibria for system (1) in the parameter spaces (a) – and (b) –. In panel (a), both the parameters and vary from 0 to 3. In panel (b), varies in the interval [40, 100] and varies from 0 to 3. The remaining parameters are listed in Table 1. Yellow-colored region describes the scenario in which all the species are unstable. All the three populations are stable in the magenta-colored region. Blue-shaded region delineates the extinction of IG-prey population, while the IG-predator population becomes extinct in the red-shaded region.
5.3. Hopf bifurcation analysis
Theorem 9 expresses the requirements for Hopf bifurcation of system (1) with reference to the system parameter , which is one of the most sensitive parameters found in the PRCC sensitivity analysis (see Fig. 1). Figure 4(a) shows the bifurcation in model (1) with reference to the system parameter , varied between 40 and 110, whereas the other parameters remained unchanged according to Table 1. With the increment of attacking rate , the system shows rich dynamics, including switching stability, highly periodic oscillation, and chaotic behavior. The model is stable about the coexisting steady-state for . As the system parameter rises, through the occurrence of Hopf bifurcation the system loses its stability at . With the further increment of the parameter , the interior steady-state becomes unstable through Hopf bifurcation. With the increment of , system (1) exhibits periodic solution with more than one period (even periodic) in the range . The system demonstrates highly periodic oscillatory behavior and experiences chaotic behavior in the range . To show the stability, highly periodic oscillatory behavior, and chaotic dynamics, we have plotted the LLE in Fig. 4(b). The LLE is computed and plotted in Fig. 4(b) with respect to the most sensitive system parameter , whereas the other parameters remained fixed as in Table 1. Figure 4(b) displays positive LLE in the region which indicates the chaotic oscillatory behavior of system (1).
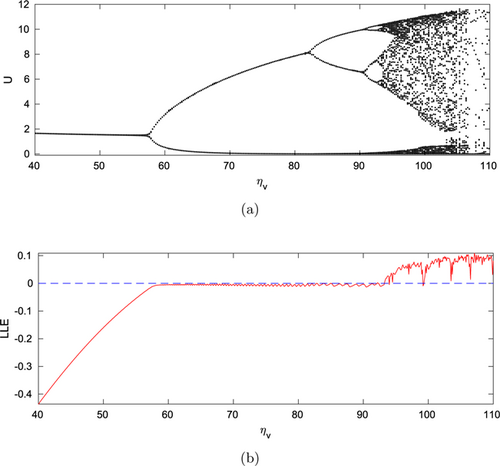
Fig. 4. Panel (a) represents the one-parameter bifurcation diagram with reference to (searching rate for IG-prey) and panel (b) represents the corresponding LLE with respect to . Other parameters are specified in Table 1.
5.4. Numerical simulation for Turing instability
In this sub-section, we will provide some numerical illustrations to support the analytical findings of Sec. 4.1 and to show the other fascinating dynamics that the spatial model (6) exhibits. From the sensitivity analysis, we obtain that is one of the most sensitive system parameters and the IG-predator has the capability of moving for searching/collecting food, so we draw the Turing–Hopf bifurcation region in the – plane. Figure 5 shows the system’s behaviors depending on and . Also, Fig. 5 splits the – plane into four distinct regions, namely stable, Hopf, Turing, and Turing–Hopf, that provides a better understanding about the complicated dynamics of IGP. It can be noticed that the system does not contain positive homogeneous steady states for and the system starts to generate a positive coexistence equilibrium point approximately from . So, we draw the Turing bifurcation boundary curve (13) that starts from . The system shows Hopf–Turing behavior if we select the two-tuple point above the Turing boundary curve and to the right-hand side of the temporal Hopf curve. If the point lies below the red curve and to the left of the blue vertical line, the nonhomogeneous system becomes stable in the space. When and have been chosen from below the red curve and to the right-hand side of the blue line, then the system shows periodic coexistence or Hopf bifurcation. The domain on the left-hand side of blue line and above the red curve forms Turing region for the nonhomogeneous system.
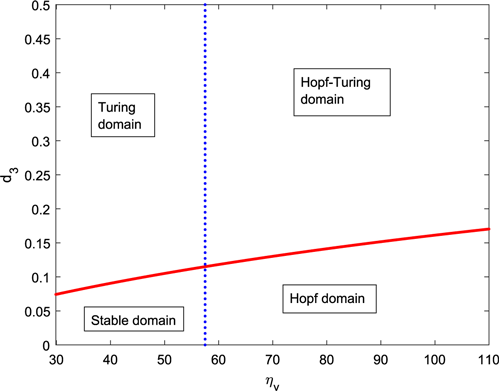
Fig. 5. The plot represents the Turing and temporal Hopf bifurcation curves in the – parameter space for system (6). The blue dotted vertical line represents the critical value of for the occurrence of Hopf bifurcation. We have drawn the red-colored curve by using Eq. (13) with and . The other parameter values are taken from Table 1.
The temporal Hopf bifurcation occurs at the threshold . Two bifurcation curves in Fig. 5 divide the – space into four different regions, namely stable domain, Turing domain, Hopf–Turing domain, and pure Hopf domain.
Now, the numerical discretization of the reaction–diffusion system (6) is briefly described. Forward Euler scheme is used to discretize the reaction–diffusion system (6) with and time step . The iterative scheme for the th time step at the grid point is as follows :
| (1) | , , and , | ||||
| (2) | , , and , where , , and are the Gaussian white noises in the -correlation space. | ||||
Figures 6 and 7 demonstrate the numerical simulations of the reaction–diffusion system (6) with the initial conditions (1) and (2), respectively. Figures 6(a)–6(c) show the Turing patterns for the basal/shared resource , IG-prey , and IG-predator populations, respectively, with , which is in the Turing region of the -parameter space (see Fig. 5). Now, we have chosen , then the coexisting equilibrium is unstable in the absence of diffusion terms (see Fig. 4). Figures 6(d)–6(f) show the spatiotemporal pattern formations for the basal resource , IG-prey , and IG-predator populations, respectively, with , which is in the Hopf–Turing region of the -parameter space (see Fig. 5). Again, we choose , then the coexisting equilibrium is unstable in the absence of diffusion terms (see Fig. 4). Figures 6(g)–6(i) show the spatiotemporal pattern formations for the basal resource , IG-prey , and IG-predator populations, respectively, with , which is in the Hopf region of the -parameter space (see Fig. 5).
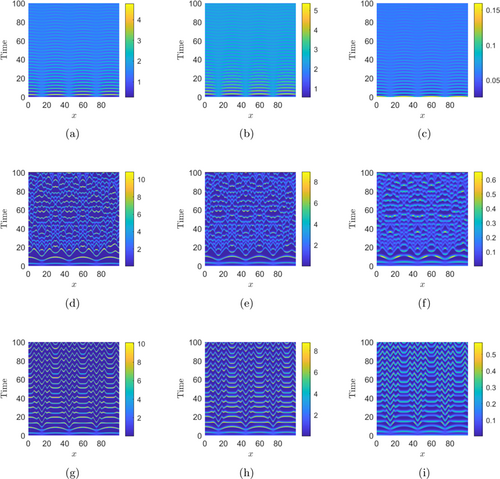
Fig. 6. Plots of distinct types of spatiotemporal patterns exhibited by shared resource (first column), IG-prey (second column), and IG-predator (third column) populations with the initial conditions (1). The parameter values for panels (a)–(c): , ; panels (d)–(f): , ; and panels (g)–(i): , , with , , and all other parameters being constant as in Table 1.
Figures 7(a)–7(c) show the Turing patterns for shared/basal resource , IG-prey , and IG-predator populations, respectively, with the initial conditions (2) and , which is in the Turing region of the -parameter space (see Fig. 5). Figures 7(d)–7(f) and 7(g)–7(i) show the numerical simulations of spatiotemporal system (6) with the initial conditions (2) and and , respectively.
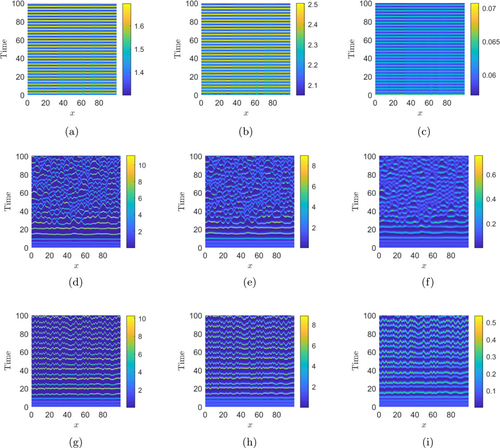
Fig. 7. Plots of different types of spatiotemporal patterns exhibited by basal resource (first column), IG-prey (second column), and IG-predator (third column) with the initial conditions (2). The system parameter values for panels (a)–(c): , ; panels (d)–(f): , ; and panels (g)–(i): , , with , , and the other parameters being constant as in Table 1.
6. Discussion and Conclusion
Only fewer studies in the literature described the dynamics of three-species models with IGP. However, to the best of our knowledge, no study has explored Turing patterns for the IGP system with type-II response function and intraspecies competition. In this work, we obtained the fascinating dynamics of a special type of three-species model, which is a combination of competition and predation. We explored the dynamics of the corresponding spatiotemporal model with one-dimensional dispersal. The fascinating chaotic behavior of the nonspatial system and the attractive patterns formed by the dispersal species are the specialty of our study.
In the proposed IGP model, we analyzed the rich dynamics of the nonspatial model and found the conditions for boundedness and uniform persistence. Analytically, the biologically feasible equilibria and the sufficient conditions for their existence have been derived. Five ecologically possible steady states have been derived and the requirements for local stability of the system about the equilibrium points have been determined. It is concluded that the local asymptotic stability of system (1) about the steady-state implies the nonexistence of the IG-predator- and IG-prey-free equilibrium points and . We found the conditions in such a manner that for any starting point from the region F, the curves representing the solution of the system go to the interior equilibrium point , which indicates the global asymptotic stability of the system. The sensitivity analysis has been done by using PRCC and it is obtained that the searching rate for intermediate prey by the IG-predator is the most effective parameter in the system. The occurrence of Hopf bifurcation with reference to has been shown theoretically as well as numerically (see Fig. 4). A variety of dynamics with the change in searching rate have been found in system (1) for the parameter set described in Table 1. The lower values of (i.e. ) stabilize the system about the interior steady-state and the system gives periodic solutions in the range . With the increment in , the periodicity of the solution curve is increased. Further increment in searching rate causes chaotic behavior or highly periodic oscillatory behavior in the range . We plotted the LLE to ensure the chaotic behavior of the system with respect to . To better understand the stability of the ecologically feasible equilibria, namely IG-prey-free, IG-predator-free, and interior steady states , we have plotted the regions representing stability in the parameter spaces – and – [see Figs. 3(a) and 3(b)]. When the natural death rate for IG-prey species and natural death rate for IG-predator species become high, then all the three species exist together in a stable region. The reason behind this is that both the intermediate prey and IG-predator get nutrients from basal resource for their survival which is shown in Fig. 3(a).
The formation of pattern by spatiotemporal ecological model has long been a significant subject in the field. There are several works focused on revealing the process of emergence of patterns of special types [Han et al., 2017; Sarkar & Khajanchi, 2023; Baghel & Dhar, 2014]. In this work, we studied the formation of spatiotemporal pattern in a diffusive IGP system with type-II response function and intraspecies competition in intermediate prey and IG-predator species. We have assumed that the shared resource has a logistic growth. At first, we performed a detailed analysis of the temporal model including equilibria, global stability analysis for interior steady-state , and the analysis of Hopf bifurcation. The formulated reaction–diffusion model delineated dispersal among three populations with the diffusive coefficients , , and . To investigate the kinetics of reaction–diffusion system (6), we determined the criterion for Turing instability in terms of system parameters and the diffusive coefficients. A relationship between the system parameter and the diffusive parameter () had been explored by plotting the temporal Hopf and Turing bifurcation curves. Turing instability condition had already been derived. The stable, Hopf, Turing, and Hopf–Turing domains were distinguished by the curves. To solve the spatial model, we took into account the zero-flux boundary condition. It is worth mentioning that intraspecies competition for nutrients and habitats extensively exists in the environments, thus it is taken into account in our study.
The proposed reaction–diffusion system (6) demonstrated different stationary and dynamic patterns that systematically encapsulated the rich spatial dynamics. Two different initial conditions including Gaussian white noise -correlation had been utilized to obtain the Turing instability criteria. Figure 6 exhibits the Turing patterns for the shared resource, intermediate prey, and IG-predator in the Turing, Hopf–Turing, and Hopf regions in the -parameter space for the initial conditions (1). Figure 7 exhibits the Turing patterns for the basal resource, IG-prey, and IG-predator in the Turing region, Hopf–Turing region, and Hopf region in the parameter space for the initial conditions (2), i.e. Gaussian white noise -correlation. We have noticed that the patterns become heterogeneous in space and stationary in time, and such stationary species become apparent for an acceptable rate of competition pressure placed on the first population species by the third species with a moderate rate of dispersal of the second population. The remaining two rivals also stay together by creating such stationary patches. It can be noted that the choice of various values of the parameters from the Hopf–Turing, Turing, and Hopf domains will ultimately result in stationary spatially heterogeneous patterns. On the other hand, we found that for all the three species, the patch size at high density grows with increasing value of .
According to our findings, the constructed system exhibits chaotic behavior for a particular parameter set. The model can be globally stable around the coexisting steady-state under certain conditions, described in Theorem 8. Only the change in natural death rates of IG-prey and IG-predator can be the cause of their extinction. There are no chances to get stability of the system about by changing the natural death rates ( and ). For the moderate value of searching rate , the solution curves form stable limit cycle. Though there are some studies dealing with IGP system from different perspectives [Han et al., 2019], the exploration of spatiotemporal dynamics in the presence of intraspecies competition and Holling type-II interaction between IG-prey and IG-predator is the specialty of our study. Han et al. [2019] considered nonlocal interaction in basal resource population and showed that nonlocal interaction is a key for Turing pattern formation. Also, they found the spatiotemporal chaotic pattern in Turing–Hopf parametric space. Our research investigated the presence of a chaotic attractor in the temporal system, as well as four forms of spatiotemporal patterns in four different parametric spaces.
By the survival of all the species engaged in the IGP model, the ecological balance can be maintained. There is a dearth of literature documenting the spatiotemporal dynamics of IGP with one-dimensional dispersal. We expect that our study will aid in understanding the fascinating dynamics of IGP in the presence of the spatial effect. One can explore the interesting dynamics of IGP by adding fear effect, Allee effect, environmental effect, etc. Furthermore, the research of IGP and spatiotemporal dynamics can be explored by taking into consideration the generalist predator or discrete time delays, or by introducing two- or three-dimensional dispersion into our model.
Funding
Suparna Dash thanks the University Grants Commission, Government of India for the financial support (NTA Ref. No. 201610023496). Subhas Khajanchi gratefully acknowledges financial support from the Government of India’s Department of Science and Technology (DST) under the Scheme “Fund for Improvement of S&T Infrastructure (FIST)” (File No. SR/FST/MS-I/2019/41).
Conflict of Interest
The authors do not have any conflict of interest to declare.
Author Contributions
All authors contributed equally to this study.
Data Availability
The data used to support our findings are included in the paper.
ORCID
Suparna Dash  https://orcid.org/0009-0007-8972-2219
Kankan Sarkar  https://orcid.org/0000-0002-2777-9611
Subhas Khajanchi  https://orcid.org/0000-0002-6533-1121
| Remember to check out the Most Cited Articles! |
|---|
|
Check out our Bifurcation & Chaos |

