Bifurcation Patterns in Some Chameleon Systems
Abstract
Chameleon chaotic systems have a special property to display various types of chaotic attractors by tuning system parameters, thereby allowing for the generation of diverse chaotic signals that are suitable for various applications. In this paper, we propose and study a class of three-dimensional quadratic chameleon systems capable of transitioning between self-excited and hidden chaotic regimes. Through systematic analysis of the systems, we can identify hidden chaotic attractors in parameter regions where no equilibria exist, or where there is a line equilibrium, or where a single stable equilibrium exists. In order to study the basic properties of the system, we carried out both local stability analysis and Hopf bifurcation analysis. Further bifurcation analysis and Lyapunov exponent calculation uncovered intricate transitions among periodic, chaotic, and hidden chaotic regimes as the system parameters varied. Through the research, we find that antimonotonicity holds significant implications for creating various types of chaotic dynamics in the chameleon systems. Furthermore, we find that by adjusting the values of parameters, the system can display a self-excited chaotic attractor, a hidden chaotic attractor with no equilibrium, a hidden chaotic attractor with a line equilibrium, or a hidden chaotic attractor with a single stable hyperbolic/nonhyperbolic equilibrium point. We are interested in a hidden chaotic system with a stable nonhyperbolic equilibrium point, for which the practical feasibility is verified through circuit simulations. The chameleon chaotic systems studied in this paper expand our understanding of the chaotic mechanisms with various equilibrium configurations.
1. Introduction
Chaos theory is a field of study that involves the mathematical analysis of complex deterministic systems exhibiting unstable aperiodic behavior. It focuses on characterizing and understanding phenomena such as sensitivity to initial conditions, mixing properties, fractal structures, and transitions to chaos. Although chaotic systems exhibit seemingly random behavior, they are, in fact, deterministic systems. This means that their future states are fully defined by their initial conditions and the governing equations. Chaos theory plays a significant role in explaining phenomena and complex systems in fields such as meteorology [Lorenz, 1963], medical sciences [West, 2013], and engineering [Vaidyanathan et al., 2023].
Mathematically, an attractor is defined as the subset of the state space toward which neighboring trajectories converge over time. Attractors capture the long-term pattern of evolution and recurrent dynamics exhibited by the system. The sensitivity to initial conditions common to chaotic dynamics is mediated by the intricate fractal interleaving of the multiple layers of the attractor [Meyers, 2002].
Leonov and his colleagues [Kuznetsov et al., 2010; Leonov et al., 2011; Leonov & Kuznetsov, 2013] were the pioneers in introducing the classification of attractors as either hidden or self-excited. They made this discovery while studying the hidden Chua attractor. A self-excited attractor refers to an attractor that has a basin of attraction that intersects with open neighborhoods that contain the equilibrium points of the dynamical system. This means that it can be numerically found by integrating the system with random initial conditions near the equilibria. On the other hand, a hidden attractor is an attractor whose basin of attraction does not intersect with any open neighborhoods containing the equilibrium points of the dynamical system. This implies that it cannot be numerically found using random initial conditions and demands special analytical–numerical procedures to locate its basin of attraction. The classification of attractors into self-excited and hidden is a crucial concept in the theory of hidden oscillations. It represents a contemporary extension of Andronov’s theory of oscillations, providing a fundamental understanding of the existence and characteristics of hidden oscillatory behavior in chaotic models [Kuznetsov et al., 2023].
The Lorenz, Chen, Chua, Lü, and Shimizu-Morioka attractors are widely recognized as instances of self-excited chaotic attractors, which emerge in systems characterized by saddle-foci [Leonov & Kuznetsov, 2015; Huang et al., 2020]. The Shilnikov theorem serves as a mathematical framework to analyze and confirm the presence of chaos involving saddle-foci in these examples [Wang et al., 2021]. Beyond the framework of Shilnikov, Wei et al. [2015] presented some jerk chaotic flows that displayed various types of nonhyperbolic equilibria. Li and Hai [2018] introduced a three-dimensional robust chaotic system with two nonhyperbolic equilibrium points, exhibiting features of amplitude and position modulation. Recently there are many other chaotic systems with nonhyperbolic equilibria [Rajagopal et al., 2018; Cai et al., 2021; Yang & Zhu, 2023]. The exploration of these systems has added new fields to the captivating world of chaos theory.
Hidden attractors have been observed in a wide variety of dynamical systems, including systems with only stable equilibrium points [Wang & Chen, 2012], systems without equilibrium points [Rech, 2022], systems with an infinite number of equilibria situated on curves or surfaces [Pham et al., 2016], and some rare systems with hidden attractors [Jafari et al., 2015]. Three-dimensional quadratic systems have attracted considerable interest and represent one of the most extensively explored topics in the field of chaos literature. Molaie et al. [2013] proposed 23 chaotic flows (SE1–LE23) that have the unusual property of having a single stable equilibrium point. Also, Jafari and Sprott [2013] proposed nine chaotic flows (LE1–LE9) with hidden attractors that have a line equilibrium. Kumarasamy et al. [2023] demonstrated both theoretically and experimentally that saddle-node bifurcations of periodic orbits provide a route for the emergence of hidden attractors in nonlinear dynamical systems, regardless of whether equilibria are present. Dong et al. [2024] investigated a chaotic system that has no equilibrium through numerical simulations and circuit implementations, and discussed engineering applications such as synchronization, offset boosting control, and image encryption.
A chameleon system is a chaotic system that can exhibit different types of chaotic attractors depending on the parameter values. This ability provides flexibility in applications needing different types of chaotic signals. Sprott [2015] discovered eleven chaotic flows, including six hidden chaotic flows and five self-excited chaotic flows, by proposing a quadratic family of chameleon systems with adjustable parameters affecting the types of singularities. Jafari et al. [2017] introduced and analyzed an example with quadratic nonlinearities. Natiq et al. [2018] presented a new 3D chaotic system with a trigonometric nonlinear controller, which exhibits self-excited attractor with an unstable equilibrium, and hidden attractor with no equilibrium or a stable equilibrium. In 2019, a study conducted by Cang et al. [2019] investigated the Yang system [Yang et al., 2010], which exhibits a range of equilibrium points such as saddle nodes, stable node-foci, saddle-foci, and nonhyperbolic equilibrium points. These distinct equilibrium points correspond to a variety of hidden and self-excited attractors that are manifested within the system. Signing et al. [2022] introduced a chameleon cryptosystem that combines chameleon chaotic systems with dynamic DNA coding to enhance image encryption security through the use of chaotic sequences.
Antimonotonicity refers to the intertwined creation and destruction of periodic orbits in nonlinear dynamical systems, leading to inevitable reversals of bifurcation cascades. It is a fundamental phenomenon revealing detailed structure in routes to chaos [Dawson et al., 1992]. Antimonotonicity has been discovered in many nonlinear systems including Chua circuits [Kocarev et al., 1993], coupled van der Pol and Duffing oscillators [Balamurali et al., 2022], jerk systems [Li et al., 2023], and more. Li et al. [2023] illustrated that antimonotonicity is important in elucidating the generation mechanism of hidden attractors with a stable equilibrium.
A Hopf bifurcation is a local bifurcation where an equilibrium of a dynamical system changes stability as a parameter is varied. It occurs when the equilibrium possesses a pair of purely imaginary eigenvalues, accompanied by specific transversality conditions and an absence of zero eigenvalues. The bifurcation can be supercritical or subcritical, resulting in either a stable or an unstable limit cycle within an invariant two-dimensional manifold, respectively. The latter scenario is potentially dangerous because stable large-amplitude limit cycles can coexist with the stable equilibrium point [Zhou et al., 2021]. Stankevich et al. [2017] and Zhao et al. [2017] studied the dynamics of the Chua systems, linking subcritical Hopf bifurcations of equilibria to the emergence of hidden attractors. By studying a family of jerk systems, Liu et al. [2021] also showed that subcritical Hopf bifurcations are closely related to the emergence of hidden attractors.
The rest of this paper is arranged as follows. Section 2 introduces a family of three-dimensional quadratic chameleon systems and presents theoretical analysis including stability analysis and Hopf bifurcation analysis of the equilibrium point. Section 3 explores the routes to chaos for five example systems from the proposed quadratic family. For each system, bifurcation analysis and Lyapunov exponents are used to characterize transitions between periodic, chaotic, and hidden chaotic regimes. In Sec. 4, the PSpice software is utilized to perform circuit design and simulation for a hidden chaotic system with a stable nonhyperbolic equilibrium point. Finally, concluding remarks are presented in Sec. 5.
2. The Proposed Systems with Hopf Bifurcation Analysis
Let us consider a family of quadratic systems in the form of
Let f=(f1,f2,f3) be the vector field of system (1). The divergence of the system is
2.1. Local stability analysis
For system (1), the number of equilibrium points depends on the parameter values m and c as follows. When m≠0 and c=0, the system does not contain any equilibrium point. In the case m=c=0, the system has an invariant line with equilibria on the y-axis. Finally, for the situation that c≠0, the system has a unique equilibrium located at E=(0,−mc−1,0).
For the general system (1), we introduce a notation
Theorem 1. If
Proof. The Jacobian matrix of system (1) at the equilibrium E is given by
Note that (2) is the discriminant of the cubic polynomial (4) with respect to λ. If δ≥0, φA(λ) has three negative roots λ1,2,3, counting multiplicity. In this case, E is a stable node. If δ<0, φA(λ) has a pair of complex conjugate roots λ1,2 and a negative root λ3, making E a stable node-focus. This proves the second conclusion and completes the proof. □
As a special case of system (1), let us consider the following system:
Corollary 1. If b>0 and 0<c<b2, then system (5) is locally asymptotically stable about the origin. Moreover, if δ1≥0, then the origin is a stable node; if δ1<0, then the origin is a stable node-focus.
Proof. As stated in Theorem 1, we have demonstrated that under the conditions specified in (3), system (1) exhibits asymptotic stability around the equilibrium point E.
Let us consider system (5), which is a special case of system (1) with m=0,d=b. The previous equilibrium E of system (1) is now the origin in system (5). By virtue of Theorem 1 and the definition of δ1 in (6), we get the two conclusions. □
Theorem 2. For system (5), if b>0 and c>b2, then the origin is a saddle-focus of index two.
Proof. For this system, the characteristic polynomial associated with the origin is expressed as
The discriminant of (7) with respect to λ is equal to
Since c>b2≥0, by Vieta’s theorem, the product of these roots is λ1λ2λ3=−c<0, indicating that λ3<0. Additionally, since c>b2, the Routh–Hurwitz criterion is not satisfied. Consequently, Reλ1=Reλ2>0. So, the origin is a saddle-focus of index two. □
Theorem 3. Consider system (5) with c=b2. The following statements hold.
| (i) | If b<0, then the origin is a saddle of index two. | ||||
| (ii) | If b>0, then the origin is a nonhyperbolic equilibrium with a two-dimensional center manifold Wc and a one-dimensional stable manifold Ws. | ||||
Proof. The Jacobian matrix of system (5) with c=b2 evaluated at the origin has the characteristic polynomial
| (i) | If b<0, then the polynomial (8) has three eigenvalues λ1,2=±√−b and λ3=−b. Thus, we have λ1,3>0 and λ2<0. This demonstrates the origin is a saddle with a two-dimensional unstable manifold and one-dimensional stable manifold, i.e. a saddle point of index two. | ||||
| (ii) | If b>0, then the polynomial (8) has three eigenvalues λ1,2=±√bi and λ3=−b. Since b>0, the origin is a nonhyperbolic equilibrium with a two-dimensional center manifold Wc and a one-dimensional stable manifold Ws. | ||||
Theorem 4. For system (5) with b=0. If c<0, then the origin is a saddle-focus of index one. If c>0, then the origin is a saddle-focus of index two.
Proof. For system (5) with b=0, the characteristic polynomial of the Jacobian matrix at the equilibrium O:(0,0,0) is expressed as follows:
2.2. Analysis of Hopf bifurcations
Theorem 5. Consider system (1) with m≥0,c>0,d>0 and b+m(1+c−1)>0. A Hopf bifurcation from the equilibrium E occurs at c=d(b+m(1+c−1)), i.e. c=c∗, where
Proof. Let p1=d,p2=b+m(1+c−1),p3=c represent the coefficients of λ2, λ, and λ0 in (4), respectively. The bifurcation parameter is chosen as c.
According to the Hopf bifurcation criterion, a Hopf bifurcation from the equilibrium E occurs when p3=p1p2 with p1,p2>0, and the transversality condition (p1p2−p3)′(c)≠0 is satisfied.
Solving the equation p3=p1p2 for c, we obtain a single positive root c∗ given by (10). By direct computation, we have
Going back to the original parameters, we can affirm that the conclusion of this theorem holds. □
Corollary 2. Consider system (5) with b,c>0. A Hopf bifurcation occurs from the origin when c=b2.
Proof. Note that system (5) is a special case of system (1) with m=0,d=b. Thus, according to Theorem 5, a Hopf bifurcation occurs in system (5) from the origin when c=b2. This completes the proof of Corollary 2. □
Setting a=3, c=b2 in system (5), we get
Theorem 6. For system (11) with b>0, the first focus quantity of the origin is given by
Furthermore, we have
Proof. By introducing the transformation
By applying the computational method presented in [Sang & Huang, 2017] to the above system, the first focus quantity of system (11) at the origin is obtained as (12).
From (12), we have
Setting c=b2 in system (5), we get
Theorem 7. Suppose that a>−10(−1) and b>0. The first focus quantity of system (13) at the origin is
Furthermore, we have
Proof. For system (13), the computation of the first focus quantity is similar to that of Theorem 6. By direct computation, we have (14) and (15). □
3. Routes to Chaos in Some Systems
In this section, we will examine the dynamical behavior of some typical chaotic systems. For each system, the bifurcation diagram and the largest Lyapunov exponent with respect to the control parameter are plotted and analyzed. The focus of this section is on elucidating the routes to hidden chaotic attractors for various systems, supplemented by dynamical and qualitative analysis.
Recall that the simultaneous creation and destruction of periodic orbits is called antimonotonicity. This phenomenon occurs repeatedly in the following five scenarios. This observation suggests that antimonotonicity emerges from the interaction between nonlinear and linear terms.
Let L1,L2,L3 be the Lyapunov exponents of a 3D system, ordered as L1≥L2≥L3. Let DKY be the Kaplan–Yorke dimension.
3.1. Scenario 1: Hidden chaotic regions without equilibrium, and a hidden chaotic attractor with a line equilibrium
Consider the following system:
With the initial conditions (x(0),y(0),z(0))=(−1,−1,−1), Fig. 1 shows the bifurcation diagram and the largest Lyapunov exponent of system (16) with respect to m over the interval [−0.05,0.15]. The bifurcation diagram well coincides with the largest Lyapunov exponent.
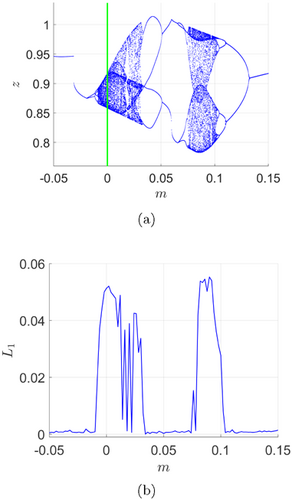
Fig. 1. Bifurcation diagram and largest Lyapunov exponent of system (16) for m∈[−0.05,0.15]. Initial data: (x(0),y(0),z(0))=(−1,−1,−1). (a) Bifurcation diagram with m varying. (b) Largest Lyapunov exponent with m varying.
Notably, at m=−0.0315, there is a sudden transition from a branch of higher-amplitude periodic orbits to a branch of lower-amplitude periodic orbits. As m increases, the system undergoes a period-doubling cascade to chaos. After m passes through a periodic island [0.035,0.075], the system re-enters chaos and eventually exhibits an inverse period-doubling cascade, leading to a periodic motion. The vertical green line is intended to emphasize that when m=0, the hidden chaotic system has a line equilibrium.
With the initial conditions (x(0),y(0),z(0))=(−1,−1,−1) and (x(0),y(0),z(0))=(−1,1,1), Fig. 2 presents the bifurcation diagram of system (16) with respect to m over the interval [−0.035,0]. Notably, within the interval [−0.0315,−0.0263], a region of periodic bistability can be observed.
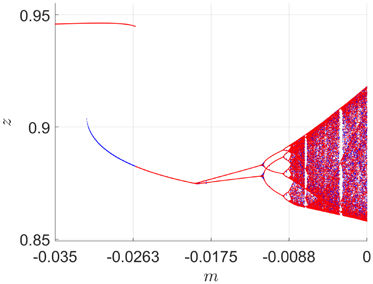
Fig. 2. Bifurcation diagram of system (16) for m∈[−0.035,0]. Initial data: (x(0),y(0),z(0))=(−1,−1,−1) (blue), (x(0),y(0),z(0))=(−1,1,1) (red).
3.2. Scenarios 2–5
3.2.1. Scenario 2: Hidden chaotic region with a line equilibrium
Consider the following system:
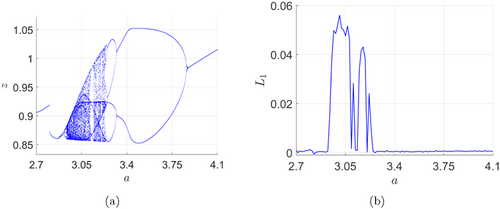
Fig. 3. (a) Bifurcation diagram and (b) largest Lyapunov exponent of system (17) for a∈[2.7,4.1]. Initial data: (x(0),y(0),z(0))=(−1,−1,−1).
3.2.2. Scenario 3: Self-excited chaotic region and hidden chaotic region
Recalling that system (11) is a special case of system (5) with (a,c)=(3,b2), the dynamics of system (11) are dependent on the value of parameter b. According to Theorem 3, when b<0, the origin is a saddle of index two. On the other hand, when b>0, the origin becomes a nonhyperbolic equilibrium. Interestingly, when b=0, the system exhibits a hidden chaotic attractor with a line equilibrium: y-axis.
With the initial conditions x(0)=y(0)=z(0)=−1, Fig. 5 shows the bifurcation diagram and the largest Lyapunov exponent of system (11) with respect to b in the range [−0.1,0.16]. Overall, the bifurcation pattern depicted in Fig. 5 bears resemblance to that exhibited in Fig. 3 for Scenario 2. Starting from a limit cycle at the lower value of b, the system exhibits a period-doubling cascade to chaos, followed by a large bubble structure back to a limit cycle. When b=0, system (11) transforms into the hidden chaotic system LE8, exhibiting a hidden chaotic attractor with a line equilibrium: y-axis. Furthermore, it is interesting to observe that for b<0, the system exhibits self-excited attractors, whereas for b≥0, hidden attractors emerge. This transition is linked to a shift in the stability at the origin, transitioning from an unstable to a stable state. In fact, according to Theorem 6, we have W1(b)<0 for 0<b≤0.16. Thus, the origin is a stable nonhyperbolic equilibrium. In summary, when examining the bifurcation diagram, we can observe the appearance of various types of attractors as the parameter increases. These include the self-excited chaotic attractor, the hidden chaotic attractor with a line equilibrium (b=0), and the hidden chaotic attractor with a stable nonhyperbolic equilibrium.
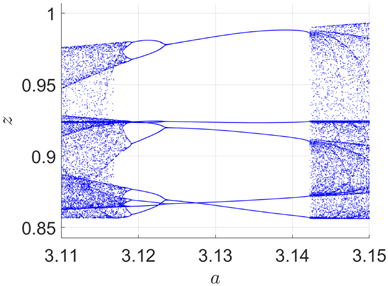
Fig. 4. A period-5 window of system (17) for a∈[3.11,3.15].
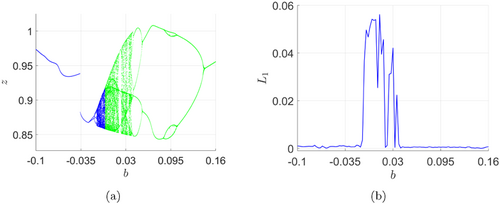
Fig. 5. (a) Bifurcation diagram and (b) largest Lyapunov exponent of system (11) for b∈[−0.1,0.16]. In panel (a), self-excited branches (blue) and hidden branches (green) are highlighted with different colors. Initial data: (x(0),y(0),z(0))=(−1,−1,−1).
For two typical parameter values b=−0.001 and b=0.004, Fig. 6 displays two distinct types of chaotic attractors exhibited by system (11). In panel (a), the system exhibits a self-excited chaotic attractor spiraling around the unstable equilibrium at the origin (red star) when b=−0.001. Panel (b) shows a hidden chaotic attractor spiraling around the stable nonhyperbolic equilibrium at the origin (green star) when b=0.004. Furthermore, Table 1 provides information on the equilibria, Lyapunov exponents, Kaplan–Yorke dimensions and initial conditions for the system when b=−0.001 and b=0.004.
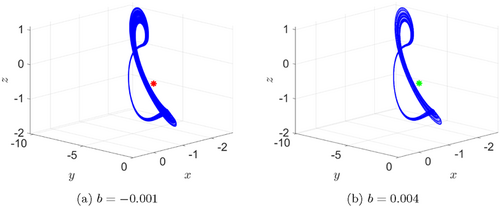
Fig. 6. Self-excited and hidden chaotic attractors of system (11) for b=−0.001,0.004, respectively. Initial data: (x(0),y(0),z(0))=(−1,−1,−1). The unstable equilibrium is denoted by a red star, while the stable equilibrium is represented by a green star.
| Parameter Values | b=−0.001 | b=0.004 |
|---|---|---|
| Equilibria | (0,0,0) | (0,0,0) |
| Eigenvalues | λ1,2=±0.03162λ3=0.001 | λ1,2=±0.06325iλ3=−0.004 |
| L1 | 0.051120 | 0.055119 |
| L2 | −0.000349 | 0.000045 |
| L3 | −0.802273 | −0.815373 |
| DKY | 2.06328 | 2.06765 |
| Initial conditions | x=y=z=−1 | |
3.2.3. Scenario 4: Self-excited chaotic regions and a hidden chaotic attractor with a line equilibrium
Consider the following system:
With the fixed initial conditions x(0)=y(0)=z(0)=−1, the bifurcation diagram and the largest Lyapunov exponent of system (18) with respect to the parameter c over the interval [−0.06,0.02] are shown in Fig. 7. Overall, the bifurcation diagram depicted in Fig. 7 can be seen as a reversed version of the one exhibited in Fig. 1 for Scenario 1. Starting from a limit cycle at c=−0.06, the system exhibits a period-doubling cascade to chaos, followed by a bubble structure back to a limit cycle. Following this, the system repeats a similar pattern: a period-doubling cascade to chaos, followed by a period-halving cascade and a hysteresis bifurcation back to a limit cycle. A periodic region (c<0) with bubble structure can be found between the two chaotic regions [−0.046,−0.036] and [−0.015,0.005]. When c=0, system (18) becomes the hidden chaotic system LE8, exhibiting a hidden chaotic attractor with a line equilibrium: y-axis. This unique value corresponding to hidden chaotic regime is highlighted by a green vertical line.
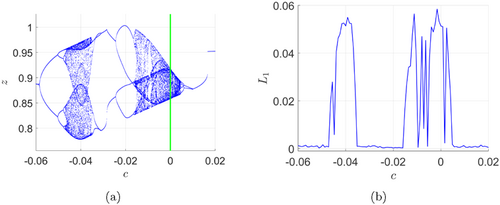
Fig. 7. (a) Bifurcation diagram and (b) largest Lyapunov exponent of system (18) for c∈[−0.06,0.02]. Initial data: (x(0),y(0),z(0))=(−1,−1,−1).
For two typical parameter values c=−0.04 and c=0, Fig. 8 displays two distinct types of chaotic attractors exhibited by system (18). With c=−0.04, panel (a) shows a self-excited chaotic attractor spiraling around the unstable equilibrium at the origin (denoted by a red star). With c=0, panel (b) shows a hidden chaotic attractor spiraling around the line equilibrium: y-axis (green line). Furthermore, Table 2 provides information on the equilibria, Lyapunov exponents, Kaplan–Yorke dimensions and initial conditions for the systems when c=−0.04 and c=0.
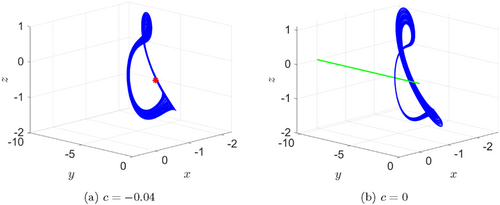
Fig. 8. Self-excited and hidden chaotic attractors of system (18) for c=−0.04, c=0, respectively. Initial data: (x(0),y(0),z(0))=(−1,−1,−1).
| Parameter Values | c=−0.04 | c=0 |
|---|---|---|
| Equilibria | (0,0,0) | (0,y,0),y∈ℝ |
| Eigenvalues | λ1,2=−0.17100±0.29618iλ3=0.34200 | λ1,2=±√yλ3=0 |
| L1 | 0.051168 | 0.051175 |
| L2 | −0.000683 | −0.000904 |
| L3 | −0.652365 | −0.804440 |
| DKY | 2.07739 | 2.06239 |
| Initial conditions | x=y=z=−1 | |
3.3. Scenario 5: A remarkably narrow hidden chaotic region and self-excited chaotic regions
Consider the following system:
A remarkably narrow stable region for the equilibrium
For system (19), the following result determines the interval of c corresponding to the stable equilibrium.
Proposition 1. For system (19), the following statements about the origin O:(0,0,0) hold:
| (i) | When c<0, it is a saddle-focus of index one. | ||||
| (ii) | When 0<c<(3100)2, it is a stable node-focus. | ||||
| (iii) | At the critical value c=(3100)2, the origin is a stable nonhyperbolic equilibrium. A supercritical Hopf bifurcation occurs from the origin at c=(3100)2. | ||||
| (iv) | When c>(3100)2, it is a saddle-focus of index two. | ||||
Proof. For this system with c≠0, the characteristic polynomial at the equilibrium O:(0,0,0) is given by
| (i) | For c<0, we have Re(λ1,2)<0 and λ3>0, and hence the origin is a saddle-focus of index one. | ||||
| (ii) | For 0<c<(3100)2, using Routh–Hurwitz criterion, we have Re(λ1,2)<0 and λ3<0. Thus, the origin is a stable node-focus. | ||||
| (iii) | When c=(3100)2, we have λ1,2=±√310i and λ3=−3100. From (12), we have W1(0.03)<0, thus the origin is a stable nonhyperbolic equilibrium. This implies that a supercritical Hopf bifurcation occurs from the origin at c=(3100)2. | ||||
| (iv) | For c>(3100)2, we have Re(λ1,2)>0 and λ3<0, and hence the origin is a saddle-focus of index two. | ||||
A remarkably narrow hidden chaotic region
We are interested in studying the dynamics of system (19) in the interval [0,9×10(−4)]. Let us begin with three typical systems.
When c=0, c=0.0006 and c=0.0009, system (19) becomes
System (22) has a hidden chaotic attractor with a line equilibrium: y-axis. In contrast, system (24) has a hidden chaotic attractor with a stable nonhyperbolic equilibrium at x=y=z=0. These hidden chaotic attractors are shown in Fig. 9. Furthermore, system (23) has a hidden chaotic attractor with a stable hyperbolic equilibrium at x=y=z=0, which is very similar to panel (b) in Fig. 9 for system (24).
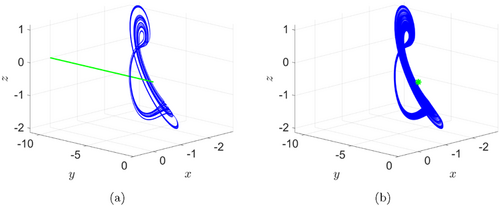
Fig. 9. Phase portraits of systems (22) and (24), with initial data (x(0),y(0),z(0))=(−1,−1,−1). (a) Hidden attractor of system (22) with a line equilibrium along the y-axis. (b) Hidden attractor of system (24) with a stable nonhyperbolic equilibrium at the point x=y=z=0.
Table 3 provides information on the equilibria, Lyapunov exponents, Kaplan–Yorke dimensions, and initial conditions for systems (22), (23), and (24).
| Systems | (22) | (23) | (24) |
|---|---|---|---|
| Equilibria | (0,y,0),y∈ℝ | (0,0,0) | (0,0,0) |
| Eigenvalues | λ1,2=−3200±1200√−1191+40000yλ3=0 | λ1,2=−0.004933±0.172560iλ3=−0.020133 | λ1,2=±√310i,λ3=−3100 |
| L1 | 0.011020 | 0.030919 | 0.041765 |
| L2 | −0.000883 | −0.000099 | −0.000390 |
| L3 | −0.779549 | −0.800942 | −0.808347 |
| DKY | 2.01300 | 2.03848 | 2.05119 |
| Initial conditions | x=y=z=−1 | ||
With the initial conditions x(0)=y(0)=z(0)=−1, Fig. 10 illustrates the bifurcation diagram of system (19) with respect to the parameter c within the interval [0,9×10⁻⁴]. The hidden chaotic region [0,9×10⁻⁴] is intermittently disrupted by periodic windows. These windows correspond to intervals where stable periodic orbits exist.
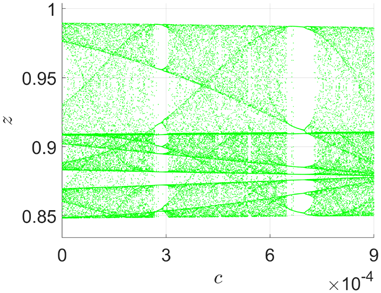
Fig. 10. Bifurcation diagram of system (19) for c∈[0,9×10⁻⁴]. Initial data: (x(0),y(0),z(0))=(−1,−1,−1).
For system (24), a cross-section of the basins of attraction of two attractors in the y(0)–z(0) plane at x(0)=0 is illustrated in Fig. 11. Initial conditions located in the white region result in unbounded orbits, those in the red region lead to the hidden chaotic attractor, and those in the magenta region lead to the stable nonhyperbolic equilibrium.
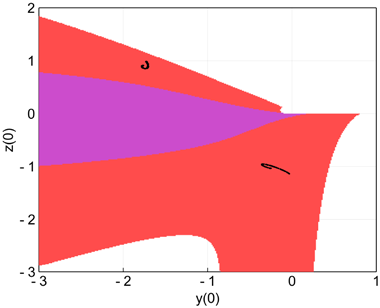
Fig. 11. Cross-section of the basins of attraction in the y(0)–z(0) plane for system (24) with x(0)=0. The white region represents initial conditions leading to unbounded orbits, the red region corresponds to the hidden chaotic attractor shown in the cross-section as black lines, and the magenta region corresponds to a stable nonhyperbolic equilibrium at the origin.
Bifurcation analysis of system (19 ) for c∈[−0.046,0.046]
Besides investigating the hidden chaotic dynamics within a limited range [0,9×10⁻⁴], we are also interested in the self-excited chaotic behavior exhibited by system (19). Figure 12 presents the bifurcation diagram and the largest Lyapunov exponent with respect to the parameter c over the interval [−0.046,0.046]. From the bifurcation diagram, we see that the parameter c impacts strongly on the behavior of system (19) and the bifurcation pattern is similar to that is shown in Fig. 7 for Scenario 4.
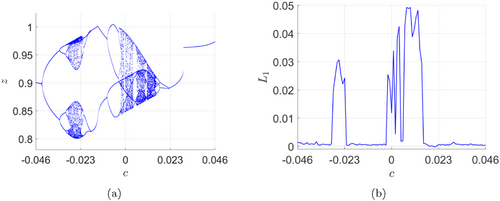
Fig. 12. (a) Bifurcation diagram and (b) largest Lyapunov exponent of system (19) for c∈[−0.046,0.046]. Initial data: (x(0),y(0),z(0))=(−1,−1,−1).
Supercritical Hopf bifurcation and bistability of system (19)
According to Proposition 1, a supercritical Hopf bifurcation occurs in system (19) from the origin at c=0.0009, which gives a branch of stable periodic orbits for c>0.0009. This can be numerically verified by examining the bifurcation diagram of Fig. 13, see the red branch for lower value of c. There are two sets of initial conditions, in which the initial conditions (−0.01,−0.01,−0.01) correspond to the red branches, and the initial conditions (−1,−1,−1) correspond to the blue branches. From Fig. 13, we have regions of periodic bistability, and regions of chaotic and periodic bistabilities.
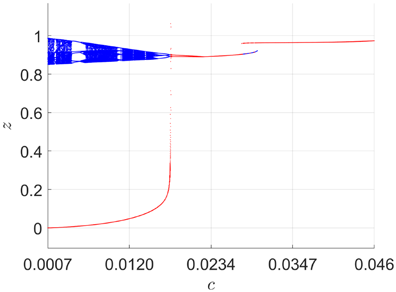
Fig. 13. Bifurcation diagram of system (19) for c∈[0.0007,0.046]. Initial data: (x(0),y(0),z(0))=(−1,−1,−1) (blue), (x(0),y(0),z(0))=(−0.01,−0.01,−0.01) (red).
Summary for system (19) for c∈[−0.046,0.046]
Through the above research, we have discovered that system (19) can exhibit a wide range of dynamical behaviors, including supercritical Hopf bifurcation, antimonotonicity, and bistability. Furthermore, through the adjustment of the parameter c, it can display a self-excited chaotic attractor, a hidden chaotic attractor with a line equilibrium (c=0), or a hidden chaotic attractor with a single stable hyperbolic/nonhyperbolic equilibrium point.
4. Analog Electric Circuit Design and Simulations
PSpice is a powerful general-purpose analog and mixed-mode circuit simulator used to verify circuit designs and predict circuit behavior. Similar to MATLAB, the accuracy of results obtained from PSpice is also affected by the selection of the discretization step [Tapche et al., 2020]. By specifying the initial conditions, such as the voltages on capacitors, we can observe the response of a circuit in the PSpice [Boui & Kengne, 2023].
An analog circuit is developed from system (24), as illustrated in Fig. 14. In the circuit, we use TL084 operational amplifiers denoted as Uk (where k=1,2,…,5), which are powered by a symmetric ±12V DC power supply. The circuit also includes resistors, capacitors, and multipliers. The resistor values are set as follows: R=10KΩ, R1=333KΩ, R2=11111KΩ, and R3=3.3333KΩ. Additionally, the capacitors are configured with C=100nF.
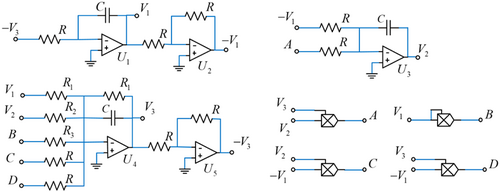
Fig. 14. Analog electric circuit diagram of system (25).
By applying Kirchhoff’s voltage law, we get the circuital system as follows:
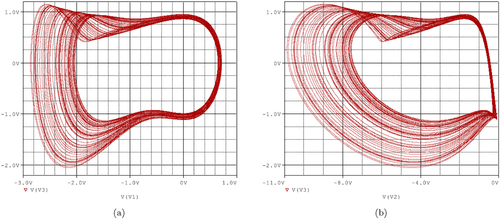
Fig. 15. PSpice simulation of projections of the hidden chaotic attractor in the circuit of Fig. 14. Initial data: (V1(0),V2(0),V3(0))=(−1V,−1V,−1V). (a) V1–V3 plane and (b) V2–V3 plane.
5. Concluding Remarks
The paper proposes and analyzes a family of chameleon chaotic systems with quadratic nonlinearities. We are interested in exploring the interconnections among periodic, chaotic, and hidden chaotic states. In order to accomplish this crucial goal, we conduct an analysis of stability and Hopf bifurcation for some systems. These fundamental findings on hyperbolic and nonhyperbolic equilibrium serve as the foundation for constructing chaotic systems with various equilibrium structures. Antimonotonicity refers to the concurrent creation and annihilation of periodic orbits. For five scenarios, we explore the bifurcation patterns, i.e. the interconnections among periodic, chaotic, and hidden chaotic states. It is shown that antimonotonicity holds significant implications for the creating various types of chaotic dynamics in chameleon systems. During the bifurcation analysis process, we discovered a hidden chaotic system with a stable nonhyperbolic equilibrium point. Through analog circuit design and simulations, we validated its practical feasibility. For general chameleon chaotic systems, establishing the transitions mechanisms among periodic, chaotic, and hidden chaotic states is a significant challenge, which needs additional theoretical analysis, bifurcation tools, and numerical simulation tools. The proposed quadratic systems will aid future research efforts on harnessing flexible chaotic signals for engineering applications.
Acknowledgments
This work was supported by the Shandong Provincial Natural Science Foundation under Grant No. ZR2018MA025.
ORCID
Lihua Fan  https://orcid.org/0009-0004-5474-2947
Bo Sang  https://orcid.org/0000-0003-3978-2225
Jie Liu  https://orcid.org/0009-0004-2667-5601
Chun Wang  https://orcid.org/0009-0006-3224-9806
Xueqing Liu  https://orcid.org/0009-0006-1041-3986
Ning Wang  https://orcid.org/0000-0002-4453-8588
Bertrand Frederick Boui A Boya  https://orcid.org/0000-0001-9688-8304
| Remember to check out the Most Cited Articles! |
|---|
|
Check out our Bifurcation & Chaos |

