Three-dimensional imaging of spatio-temporal dynamics of small blood capillary network in the cortex based on optical coherence tomography: A review
Abstract
Optical coherence tomography angiography (OCTA) has emerged as an advanced in vivo imaging modality, which is widely used for the clinic ophthalmology and neuroscience research in the rodent brain cortex among others. Based on the high numerical aperture (NA) probing lens and the motion-corrected algorithms, a high-resolution imaging technique called OCT micro-angiography is applied to resolve the small blood capillary vessels ranging from 5μμm to 10μμm in diameter. As OCT-based techniques are recently evolving further from the structural imaging of capillaries toward spatio-temporal dynamic imaging of blood flow in capillaries, here we present a review on the latest techniques for the dynamic flow imaging. Studies on capillary blood flow using these techniques will help us better understand the roles of capillary blood flow for normal functioning of the brain as well as how it malfunctions in diseases.
1. Introduction
Capillaries spreading over the whole body and linked to the arteria and veins play an important role on normal functioning and a range of dysfunctions of the central nervous system. In the brain cortex, capillaries are the major interfaces that transport nutrition from upper vessels to brain tissues and cells and discharge the waste reversely. The normal functioning of the brain results from the proper regulation of cerebral blood flow (CBF) because oxygen and glucose should be supplied by the blood to meet spatiotemporally varying metabolic needs, location by location, moment to moment.1,2 The evidence shows that cerebrovascular flow abnormalities are associated with the number of metabolic waste and the dysregulated oxygen and glucose supply in some diseases.3,4 For example, reduced regional CBF in the frontal lobes is closely involved with the severity of dementia,5,6 and cerebrovascular hypoperfusion results in subsequent neuronal degeneration.7,8 Functional magnetic resonance imaging (fMRI) existing for a long time has been used to investigate the neurovascular coupling to understand the cerebral energy supply regulation based on the interpretation of human neuroimaging data, while the spatial resolution of fMRI is restricted to the scope at sub-millimeter level.9,10 The poor resolution of fMRI prevents the observation of small capillary vessels, which ranges 5–10μμm in diameter.
Optical techniques have been used for microscopic imaging of cortical vasculature in animal models in vivo. By introducing the contrast agent into the blood circulation, noninvasive transcranial optical imaging became possible through the intact skull.11,12 Yet, visualization of individual small capillary vessels using these transcranial imaging techniques has not been demonstrated. Considering the diameter of small capillaries, micron resolution is necessary for the imaging tool to visualize them and enable analysis of their behavior individually. So far, two-photon microscopy has been used for capillary blood flow measurement in the rodent brain cortex with the micrometer resolution.13 However, the scanning mechanism of this method requires continuous acquisition of the signal from a fixed location of a capillary to capture the passage of red blood cells (RBCs) through, which makes it difficult to investigate a large number of capillaries at the same time.14 Also, these techniques based on fluorescence make it difficult to perform a longitudinal investigation in the same animal along the lifespan which is often desired for studying slowly developing vascular deficiency. As a label-free alternative, the currently popular photoacoustic microscope shined a pulsed laser onto the animal body then received the ultrasound signal to reconstruct the sample structure contrast,15 which can achieve the lateral resolution down to several microns, but the axial resolution is still above 10μμm.16,17
Optical coherence tomography (OCT) implements a 3D microscopic imaging capability with the combination of employing a broadband light source and the mechanism of the Michelson interferometer. Time-domain OCT (TD-OCT) first emerged to perform the 3D imaging,18 while the speed limited to the movement of the reference mirror and the signal-to-noise ratio (SNR) was low. Based on the spectral measurement and Fourier transform method, Fourier-domain OCT (FD-OCT) benefitting from higher imaging speed and SNR compared with TD-OCT is preferred by scientists. FD-OCT has been widely used in clinical ophthalmology19,20 and recently adopted for neuroscience research in the rodent brain cortex.21,22 The lateral resolution of FD-OCT is determined in the same manner to the conventional confocal microscope while the axial resolution attributes to the bandwidth of the light source, which now can reach down to 1μμm in scattering tissue.23 The speed of FD-OCT is 1–2 orders of magnitude faster than that of conventional two-photon microscopes, because the acquisition in axial direction is performed in parallel in FD-OCT. Whereas the previous use of OCT mainly focuses on tissue structures, several OCT techniques for imaging movement in biological systems (e.g., blood flow) have been developed and applied for basic research24 and clinical application.25,26
Pioneering works of adopting FD-OCT for neuroscience research focused on visualizing vessels in the cerebral cortex of rodents in vivo. Based on the correlation statistic mapping of the OCT intensity images, the microvasculature of a mouse brain in vivo was imaged, called OCT angiography (OCTA), visualizing vessels with the diameters of down to 20–30μμm.27 Applying an advanced double correlation method and Wiener filtering enabled visualization of the subcutaneous microcirculation vascular network,28 a simple method of repeating two B-scans at each Y position with FD-OCT and extracting the dynamic component was proposed29 and has been widely used thus far.30 However, until being demonstrated with a high-numerical aperture (NA) objective as discussed in Sec. 2, these methods were unable to visualize individual capillary vessels, which range 5–10μμm in diameter.
OCT also has been advanced for quantitative blood flow imaging. Doppler OCT (DOCT) has been used for quantitative imaging of absolute CBF in arterioles and venules.31,32 Its application to blood flow measurement in small capillaries, however, has been restricted so far.33 Major reasons for this include the discrete nature of RBCs in capillaries (i.e., RBCs pass one by one in capillaries) that fails in producing a continuous and linear change in the phase signal used by conventional Doppler OCT, and the uncorrected angles of Doppler measurement severely underestimate the velocities for horizontally oriented flows. It has motivated researchers to develop different approaches based on OCT for quantitative imaging of RBC flow in small blood capillary vessels. Here, we review the latest advances in this area.
In this review, the complex signal decorrelation method for OCTA is first briefly described, where the FD-OCT system and algorithms for OCTA are covered as well. Then, we organize and discuss three latest developed techniques for spatio-temporal imaging of RBC flow in small capillaries: the bandwidth mapping of the power spectrum density (PSD), the intensity-fluctuation-based technique, and the phase-resolved measurement. For each method, technical details for the measurement of RBC speed, flux and density are presented, and the merit and demerit are discussed. This review will serve as a technical guide for researchers who are interested in using the latest OCT techniques for neuroscience research in animal models.
2. Structural Imaging of Capillary Vessels: Technical Basis of OCT Angiography and Micro-Angiography
For FD-OCT to obtain the axial reflectivity with the resolution of micrometer, it should measure and process a broad spectrum using a line-scan camera, since the common design in FD-OCT is based on the Michelson interferometer as shown in Fig. 1(a). The system is composed of three major components: the light source, sample and reference arms and spectral interferometer. Based on the development of the broadband light source over a wide range of wavebands, the center wavelength in FD-OCT mainly locates at 1.3, 1, 0.8 and 0.55μμm.34,35,36,37 The light source providing longer wavelengths can penetrate the tissue deeper,38 while the visible light source enables spectroscopic analysis of blood.39 The bandwidth of the light source of FD-OCT spans from tens of nanometers to hundreds of nanometers. In the FD-OCT, the axial resolution is in inverse relation with the bandwidth and proportional to the square of the center wavelength, so both the larger bandwidth and the shorter center wavelength can result in higher axial resolution.
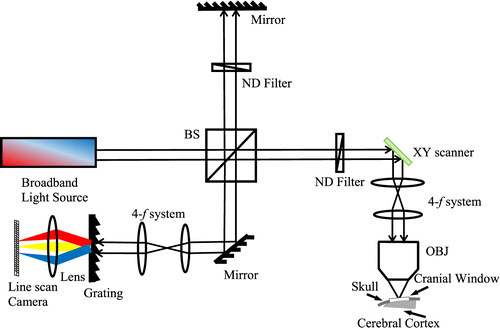
Fig. 1. A systematic scheme for OCT application, BS: beam splitter, NDF: neutral density filter, OBJ: objective.
In the sample arm, a collimated beam is incident on the two-axials scanner and scanned in a raster pattern for volumetric imaging. The most popular clinic application in FD-OCT has been applied to the inspection of eyes, which can be done using a narrow, collimated beam without any objective lens.40,41 For imaging the animal brain cortex, appropriate objective lenses are chosen and used for the desired lateral resolution. In the reference arm, the same optical elements as that used in the sample arm are adopted to match the dispersion consistency except that a neutral density filter is added to attenuate the power, and a mirror is used to reflect the beam at the end.
The third part is the spectral interferometer, which comprises the diffraction grating, focal lens and a line-scan camera. While the bandwidth of the light source determines the axial resolution, this detecting system determines the maximal imaging depth, SNR, sensitivity drop-off and sampling interval in depth.42,43 For example, our commercial FD-OCT system (Thorlabs) has a center wavelength of 1300nm and the bandwidth of 170nm, leading to the axial resolution of 3.5μμm in tissue. The lateral resolution is adjustable using different objectives (e.g., 3.5 and 7μμm with 10×10× and 5×5× objectives (Mitutoyo), respectively).
To reconstruct a 3D structural image from a set of raw spectral data, a series of data processing algorithms are applied, including spectral calibration, k-space uniformization and dispersion compensation.39,44 Meanwhile, to realize the angiography, two B-scans are repeated at each Y position with a time interval ranging from 5ms to 10ms depending on the desired dynamic range.45 In one B-scan, the constructed complex signal contains static scattering component, dynamic scattering component and noise component.33 The static part represents the tissue and the dynamic part can represent blood flow. The principle of OCT angiography is to extract the dynamic part from the hybrid signal. The basic idea is that the static component should be unchanged between two repeated B-scans.
We simply tested this idea using a static diffusive sample (WS-1, Oceans Optics), where two B-scans are repeated with the time interval of 10ms. The reconstructed intensity distribution is shown in Fig. 2(a). To quantify the OCTA noise level inherent to the system, we measured the coefficient of variation (COV) as a function of the depth after averaging the data along the xx-axis (Fig. 2(b)). It should be noted that the COV shown in Fig. 2(b) was obtained through the phase correction algorithm. The lowest COV value is ∼4∼4% where the intensity is highest. The COV value becomes higher (i.e., larger noise) as 6% when the intensity becomes the half of the maximum (at the position deeper by 19 voxels or ∼60μ∼60μm). At the position as deep as 113 voxels or ∼350μ∼350μm where the intensity becomes 10% of the maximum, the COV increases to 37%. This test suggests that OCTA can clearly visualize a vessel deep down to >350μ>350μm (the rodent brain cortex is more transparent than the static sample used here) as long as blood flow through it produces a relative change in the complex-valued OCT signal larger than 37% (which is the case in typical animal brain OCT imaging, although the produced change depends on the time interval in principle).
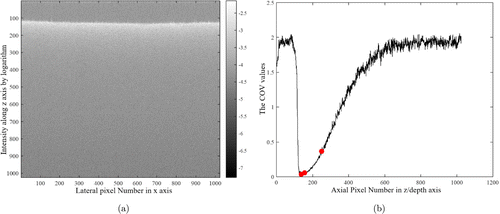
Fig. 2. The results of a static diffusive sample. (a) A cross-sectional image captured from a static diffusive sample. An intensity map is presented in logarithm. (b) The COV curve along z direction by averaging the data in x direction. Three COV values (COV=(COV= 4%, 6% and 37%)) are marked where the axial positions are z=z= 138, 157 and 251 pixels. These depths are selected as those where the OCT signal intensity becomes the maximum, half of the maximum, and 10% of the maximum, respectively.
A simple approach to remove the static component and emphasize the dynamic component between two B-scans is as follows46 :
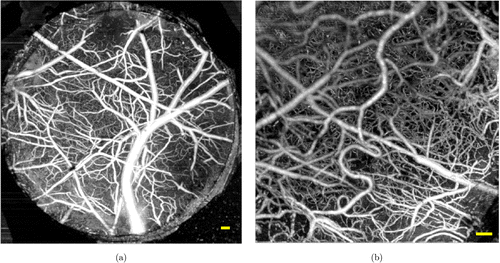
Fig. 3. OCTA and OCT micro-angiogram captured from the mouse brain cortex. (a) A maximum intensity projection (MIP) of OCTA over the field-of-view (FOV) of 3mm×mm× 3mm, which was obtained using our 5×5× objective (7-μμm lateral resolution); (b) A MIP of OCT micro-angiogram over the FOV of 1.5mm×mm× 1.5mm, which was imaged using our 10×10× objective (3.5-μμm lateral resolution). Scale bar (yellow): 100μμm.
3. Spatio-Temporal Imaging of RBC Flow in Capillary Vessels
DOCT has been verified to measure the absolute blood velocity in each well-defined voxel,49,50 while two conditions should be met that the transverse velocity profile is well defined and the probing beam is not perpendicular to the vessels of interest.51,52 However, blood flow in capillaries of the brain cortex is usually transversal (i.e., nearly perpendicular to the OCT probing beam), and RBC flow in capillaries is single file.53 The physiological speed of RBC in small capillaries is generally lower than 1mm/s,54 which is often out of the dynamic range of typical DOCT. For these reasons, despite of its importance in understanding the cerebral normal functioning in health and malfunctioning in disease, accurate measurements of RBC flow in capillaries have been unsuccessful with DOCT. This section summarizes and discusses three recent techniques for the velocity measurement of RBC in capillaries using OCT. They draw in the insight of the spatio-temporal characteristic of blood perfusion in the capillaries.
3.1. Power-spectrum-bandwidth-based measurement
To implement the RBC speed measurement in small capillaries, Srinivasan et al.33 developed a method based on the OCT micro-angiography technique. The method estimates the width of the power spectrum of the complex electric field that is back scattered from RBCs when they are traversing a voxel. In each voxel, the OCT signal can be expressed as the superposition of three terms: a static scattering component, a dynamic scattering component, and additive noise52,54
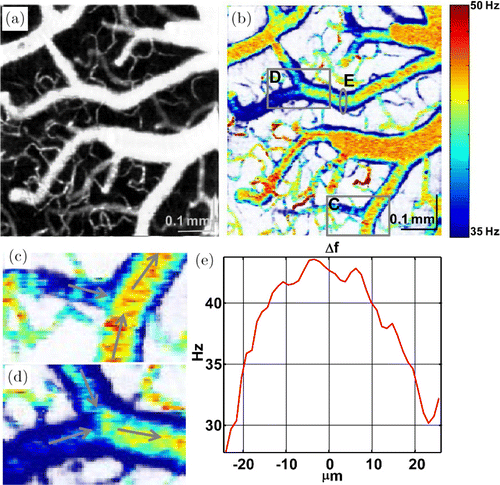
Fig. 4. A vascular network involving capillaries and large vessels exhibits the distribution of the PSD bandwidth as imaged from the rat brain cortex. (a) MIP of OCT micro-angiogram. (b) A bandwidth map displayed in color scale. (c–d) Zoom of two branch segments in (b) indicate the dynamic variation in each branch. (e) A bandwidth profile of a cross-sectional plane in (b) shows a similar parabolic distribution. Reprinted with permission from Ref. 33, [OSA].
However, one of the limitations of this technique is that it does not directly measure the flow speed but only presents indirect estimates in terms of the PSD bandwidth. To overcome this limitation, the authors presented two models to build a relationship between the bandwidth of PSD and true RBC velocity, under the assumption that RBCs move uniformly through a voxel.52,55 In particular, they used the standard method of two-photon line scanning microscopy and compared its measurements to the PSD bandwidth measurements. Although this comparison shows a correlation between the PSD bandwidth and the RBC velocity in the range from 0mm/s to 1mm/s, the relationship was somewhat ambiguous and nonlinear.51,52
3.2. Intensity-fluctuation-based measurement
Since RBCs result in relatively larger backscattering than blood plasma,56 Lee et al.57 proposed and demonstrated that the OCT signal amplitude at the voxel of a capillary vessel center goes up and drops down when one RBC is passing though the voxel. To capture this RBC passage, the method repeated 1024 B-scans in series with the time interval of 4ms.57 While these data are reconstructed to the OCT intensity as I(z,x,t), where z, x and t are the axial axis, fast axis and time, respectively, the authors analyzed the intensity data to provide three evidences supporting that individual peaks in the OCT signal amplitude represent RBC passages: (1) The spatiotemporal change in the OCT signal amplitude at several voxels nearby the center of capillary revealed that the peaks appear only across 3–4 neighboring voxels, the extent of which agrees with the size of RBC (Fig. 5(d)); (2) The pulse peaks in different capillaries were captured at different time moment, implying that the peaks are not due to the animal’s cardiac and respiratory motions which would cause synchronized peaks if any48 (Fig. 5(e)); (3) When OCT scanned a line aligned with a capillary segment like in the conventional two-photon line scan microscope,53 it produced stripe patterns signifying that RBCs move along the capillary segment, similar to the pattern used in the two-photon method (Figs. 5(f)–5(h)).
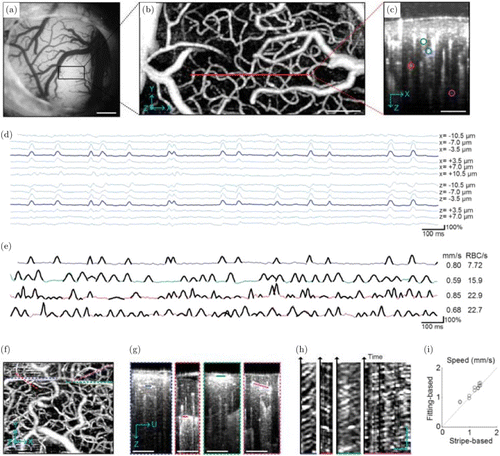
Fig. 5. (a) A microscopic image of a mouse brain cortex through the cranial window. (b) The MIP of the OCT micro-angiogram over the area indicated by the black box in (a). (c) The cross-section of the 3D micro-angiogram along the red line in (b), where several capillaries are marked with color circles. (d) The intensity fluctuation of the OCT signal along a 2-s course. Each time course was captured at the given pixels located at/around the center of the capillaries. (e) The intensity fluctuation of the OCT signal in 2-s course captured from four capillaries as selected in (c). The RBC velocity and flux estimated from these time courses are presented on the right side. (f–h) Stripe patterns in OCT intensity imaging. A time series of B-scans were repeated along each of four capillaries (dashed lines in (f)). Four capillary segments were selected from the cross-sectional planes as marked with solid lines in (g), from which the OCT intensity patterns in the space and time were extracted to I(ξ,t), where ξ is the axis along the capillary segment in (g) and t is the observed time course. This data for each capillary is presented in (h). (i) RBC velocity comparison based on both intensity fluctuation fitting method and stripe-based measurement.53Bars=500μm in A, 100μm in B, C and F, 20μm and 100ms in H. Reprinted from Ref.57.
Based on the validation, the RBC flux, speed and density were estimated using the models defined by the authors. The RBC flux can easily be counted from the peak number per unit time. For the RBC speed, a Gaussian function was used to fit the RBC pulse and the mean width of this pulse was negatively correlated with the mean RBC speed. The RBC density in each capillary can be calculated from the relation: Flux=Speed×Density.
Though analyzing the intensity fluctuation of small capillaries in a cross-sectional plane helps obtain the dynamics of RBCs, the method needs to acquire hundreds of B-scans at each y position. It means that the acquisition time takes up to tens of minutes for a volume, which would be fine for investigating microcirculation patterns in the resting state but limits its application in studying rapid changes in the microcirculation pattern (e.g., due to neural activation). Thus, Lee et al.58 proposed another method that measures the RBC flux indirectly but much faster than the above method. This second method repeated only two B-scans at each Y position. Authors applied the finding that RBC passage causes a variation in the OCT signal intensity, in order to establish a model that estimates the RBC flux from statistical data of the intensity variation. In detail, the statistical intensity variation was calculated from two B-scans :
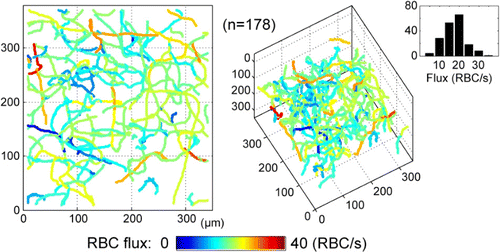
Fig. 6. The RBCs flux distribution in a 3D capillary network. On the right side, a RBCs flux histogram is drawn using 178 capillaries segments. Reprinted from Ref. 58, [OSA].
3.3. Phase-resolved tracing of RBC passage
Although the RBC-tracing technique introduced in the previous section successfully demonstrated OCT measurement of capillary blood flow for the first time, it has an ambiguity in the direction of RBC flow as it does not use any phase information of the OCT signal. As a pioneering work using OCT phase information to measure the RBC velocity in capillary, Ren et al.62 proposed a particle counting ultrahigh-resolution optical Doppler tomography (pc-μODT), which detected the Doppler phase transients when the single file RBC passing through the imaging cross-section. The authors first demonstrated a phase-intensity-mapping (PIM) algorithm to optimize the detection sensitivity of μODT.63 Based on this PIM algorithm, 3D μODT was performed to localize the individual capillaries of interest. Combination of this μODT and the particle counting method, called pc-μODT, enabled them to estimate the RBC velocity in capillaries. In detail, five time-lapsed μODT frames were captured to provide sufficient temporal resolution for computing the RBC velocity during RBC passage through the capillary. The RBC velocity was expressed
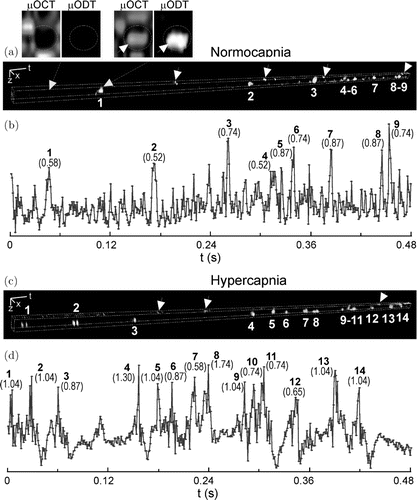
Fig. 7. The RBC velocity in one capillary measured by pc-μODT. (a) and (c) display the spatiotemporal single file RBC images; (b) and (d) present the RBC signal traces along time. The two sublets on the top show the Doppler phase transient without and with an RBC passing through the capillary. Reprinted from Ref. 62, [AIP].
Recently, Tang et al.64 addressed the ambiguity of the direction of RBC flow based on the phase information. Whereas Lee et al. repeated hundreds of B-scans, these authors repeated hundreds of A-scans (i.e., M-mode scanning) to capture any linear change in the OCT phase signal due to RBC passage. By repeating hundreds of A-scans, the dynamics of the voxels in z-axis can be fast captured. Various time durations of continuously acquiring A-scans at each lateral (x and y) position (from 1ms to 16ms) were tested, which helped gather the individual RBC flow without any discontinuity. On these time-series data of A-scans, a high-pass filter was applied to isolate the dynamic component from the hybrid signal,52 and then a phase unwrapped algorithm was applied to the remaining part to obtain a time course of the OCT phase signal. Several examples presented in the paper demonstrate that this M-mode method can detect the linear phase change due to RBC passage in capillaries. As shown in Fig. 8, three axial speeds of 0.55, 1.44 and –0.94mm/s in capillary were measured by authors. 800 A-scans through the M-mode scanning strategy took ∼16ms (A-line sampling rate: 47,000/s). A high-pass filter with the cutoff frequency of 200Hz was applied to remove the stationary signal component and the noise, thereby, a more robust phase shift for RBC flow was achieved which is marked by the red lines in the second and third rows of Fig. 8.
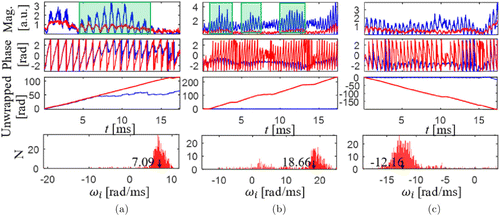
Fig. 8. RBC speed measurement procedures based on OCT detection with three different axial velocity (three columns). The first row shows the OCT signal magnitudes and the green shadows mean the RBC passages. The second row shows the OCT phase signal. The third row shows the unwrapped phase signal. The fourth row shows the histogram of the phase slope. Blue lines: OCT raw data; red lines: high-pass-filtered signal. Reprinted from Ref. 64, [OSA].
Each piece of the linear phase change was used to calculate angular frequency: ω0=dφ/dt. By averaging this frequency over all pieces observed in a single time course
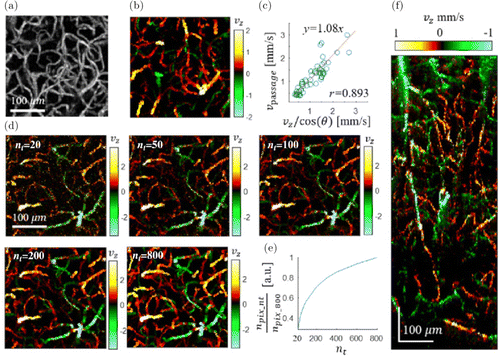
Fig. 9. (a) The en face MIP of 3D OCT micro-angiogram over the depth from 170μm to 330μm of a mouse brain cortex. b) The en face MIP mapping of the axial velocity in capillaries over the same FOV in (a). (c) A comparison between the presented phase-based method and the previous intensity-based method (50 selected capillaries). (d) The effect of the number of A-scans for each XY position (20, 50, 100, 200 and 800) on the MIP axial velocity map. (e) The number of pixels exhibiting axial velocity values as a function of the number of repeated A-scans, as normalized by that of the maximum A-scan number (800). (f) A cross-sectional (x−z) MIP map of the axial speed over ∼100μm along Y direction. The positive value means the blood flowing to the brain cortex surface. Reprinted from Ref. 64, [OSA].
4. Conclusion and Discussion
Recent advances in OCT measurement of capillary RBC flow have been reviewed as an attractive and promising methodology for investigating the neurovascular coupling and pathological changes in the rodent brain cortex. To measure RBC flow in individual capillaries with the diameter of 5–10μm, a sufficient resolution of OCT should be realized. For example, when used with a high-NA objective (Mituyoto 10×), our OCT system can resolve a voxel with the size of 3.5μm (x)×3.5μm (y)× 3.5μm (z), whereas the OCT micro-angiogram typically needs to repeat only two B-scans for 3D structural mapping of capillary RBC flow. Hundreds of B-scans were repeated at each Y position for the power-spectrum-bandwidth-based technique (Sec. 3.1) and RBC-passage-tracing technique (the first one in Sec. 3.2). Hundreds of A-scans were repeated at each X–Y position for the phase-resolved RBC-passage-tracing method (Sec. 3.3). Although these numbers of repeated scans lead to longer durations required for volumetric imaging (up to tens of minutes), they provide unprecedented methods for accurately mapping RBC flow patterns over a capillary network. The statistical intensity variation-based technique (the second one in Sec. 3.2) establishes the feasibility of tracing rapid changes in capillary RBC flow properties.
Unlike blood flow in large arteries and veins, the RBC flow in small capillary is relatively slow, discontinuous and single-file, which surpasses the ability of conventional DOCT. Three techniques reviewed in this paper have commonly addressed this unique nature of capillary RBC flow but in different manners. The first technique utilizes the fact that RBC flow in capillaries broadens the bandwidth of the dynamic component in OCT signal. By estimating the frequency bandwidth of the PSD, it establishes a mapping between the bandwidth and RBC velocity. The second technique is based on the more direct observation of individual RBC passage and thus enables explicit quantifications of the RBC flux, speed and density. The latest technique repeating A-scans demonstrates linear phase changes due to RBC passage in capillaries, additionally providing the direction of RBC flow. This review will work as a guide to a range of investigators who are intertested in spatiotemporal patterns of cortical microcirculation and their changes in disease but have suffered from a lack of appropriate methodology.
It should be noted that an inevitable craniotomy or thinning of the skull is performed to implement the OCT based angiography on the mouse brain. Injury to the animal is often irreversible and sometimes it induces the associated inflammatory response. Also, the complexity of the surgical procedures needs high skilled personnel in laboratory. Reducing the scattering of the skull has been demonstrated to image the cortical structures without doing the craniotomy.67,68 Meanwhile, the tissue optical clearing techniques can reduce the scattering of tissue, with speckle noise being decreased and the penetration depth being larger.69,70,71 When combined with optical clearing techniques, the OCT methods reviewed in this paper could work without doing the craniotomy on the mouse brain.
As ophthalmology has been the major application area of OCT with clinical impact, and because capillary blood flow provides importatnt physiological/pathological information of the retina, OCT imaging for visualizing capillary blood vessels and their RBC flow will have a high impact. However, due to the imperfect optics of the eye, the smallest beam size on the retina was limited to 10–13μm,72,73 which is larger the diameter of the single capillary vessel (∼5–10μm). A technique called adaptive optics is used to achieve a clear sight by correcting the abberation of the optics, which is originated from the astronomy where the images of the stars are blurred because of the turbulence in the air. With the development of the adaptive optics ophthalmoscopy, the single blood cell speed in capillaries in humans and mice has been reported.74,75,76 Comined adaptive optics and OCTA techniques, the lateral resolution has been explored smaller than 10μm,77 suggesting the feasiblity of applying the reviewed methods or other approach toward the OCT imaging of small blood capillary network flow in the human retina.
Acknowledgment
National Institute of Biomedical Imaging and Bioengineering (R00EB014879), Natural Science Foundation of Jiangsu Province (Grant no. BK20190697) and Natural Science Foundation of China (61901222).
Conflict of Interest
No conflict of interest.


