SOFIA at Full Operation Capability: Technical Performance
Abstract
The Stratospheric Observatory for Infrared Astronomy (SOFIA), the largest airborne observatory in the world, is in full operation capability since February 2014 and is currently completing its Observing Cycle 6 Program. The first four years of operation have provided the opportunity to assess the high-level observatory’s technical performance and to identify additional observatory upgrades. Since the start of routine operations, performance and productivity in several areas of the observatory, including science, operations and engineering, have been tracked by metrics and statistics. In this paper we present the general observatory technical performance as the observatory has reached its maturity and has served the science community with over 2900h of scientific observations.
1. Introduction
In May 2014, NASA’s Stratospheric Observatory for Infrared Astronomy (SOFIA) reached full operational capability (FOC) following a short period of Early Science operations, aimed at demonstrating the observatory’s potential to make discoveries about the infrared universe (Young et al., 2012; Temi et al., 2014). During these four years past FOC, the observatory has allocated over 2600 research hours to General Observers (GO) through peer-reviewed proposals selected through competed international solicitations, plus an additional 300h awards to Instrument Principal Investigators (PI) (Ennico et al., 2018; Yorke et al., 2018). In this paper, we focus our attention on the technical performance of the observatory as it impacts the quality of science obtained. We report on key technical performance metrics that are tracked over time in order to monitor and trend performance during science operations and to guide investments that improve the observatory’s performance.
The SOFIA Observatory System consists of a set of airborne and ground elements (Ali et al., 2018; Leppik et al., 2018) that work together to collect, process and disseminate astronomical data. The major elements of the system are: the aircraft, which houses the equipment necessary for astronomical observations; the Telescope Assembly (TA), which collects and focuses the IR and visible energy onto the Science Instrument (SI); the SIs, which collect the astronomical data; the Mission Controls and Communication System (MCCS), which controls the observatory and interfaces with the aircraft, TA, and SI; the Data Cycle System (DCS), which is the science proposal submittal and archival system. The science data archive will be transitioned from the DCS to the Infrared Science Archive (IRSA) in 2019. Many of these systems are described in detail in complementary papers that are part of this JAI special issue dedicated to SOFIA. We refer the reader to these papers for an in-depth look at these elements.
Figure 1 shows a basic observatory architecture diagram with some of the observatory elements and the associated interfaces and data flow, starting from when a Science Investigator submits a proposal into the DCS proposal tool and concluding when the data is received from the DCS Archive. Many support systems, such as the Mirror Coating Facility, as well as some observatory systems are not depicted.
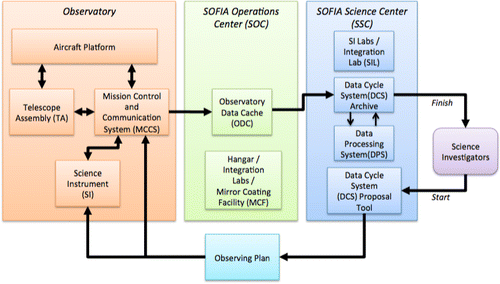
Fig. 1. System interfaces and data flow.
The Telescope Assembly is the central and most critical element in the observatory system, and in conjunction with the science instrument suite, impacts the overall technical performance of the observatory. The TA is a 2.7m (2.5m unobscured) telescope of Cassegrain design (Krabbe, 2000, 2002, 2003; Kaercher, 2003, 2010, 2016), with provisions for Nasmyth focal plane mounting of SIs, and includes supporting control, monitoring and communications equipment. SIs consist of a focal plane assembly mounted to the TA Instrument Flange, support electronics installed in the aircraft cabin in the counterweight rack and the investigator station in the experimenter racks, and the associated cabling.
Each SI in the current suite of SOFIA instruments is presented with a dedicated paper in this JAI issue. Current science instrument status and future planned upgrades are discussed in detail in a series of papers presented in this issue (Richter et al., 2018; Herter et al., 2018; Fischer et al., 2018; Colditz et al., 2018; Harper et al., 2018; Risacher et al., 2018).
Since the start of routine operations, a comprehensive SOFIA Metrics and Statistics Program has been developed and it is currently used by the SOFIA Program to track performance and productivity in several areas of the observatory, including science, operations and engineering. During SOFIA’s development phase, performance measurements (metrics) were primarily collected to verify and validate that requirements were met. Now, as SOFIA has reached FOC, metrics and statistics will track observatory scientific productivity, efficiency and performance, provide visibility into actual versus planned productivity and performance, and inform priorities for how engineering and staffing dollars are spent.
This paper is organized as follows. We present an overview of contributions to the observatory technical performance in Sec. 2, while Sec. 3 describes the data set collected to evaluate the performance. The top level technical performance, which includes pointing stability and accuracy, image quality, TA emissivity and its induced polarization, are presented in detail in Sec. 4. A summary of the performance is given in Sec. 5.
2. Overview of Contributions to Observatory Technical Performance
Observatory sensitivity was decomposed into a budget allocation to the various parameters that affect it. At a top level, image size, image shape and observatory emissivity have major impact on imaging and spectroscopic sensitivity. For polarization observations, we added a requirement to limit the level of contamination of polarization by the Observatory.
Image size is categorized by time domain: high-frequency motion such as jitter, and physics that acts on all timescales such as diffraction and shear-layer effects, will be blurring factors present during the shortest of exposure times. Lower frequency motions, such as pointing inaccuracies, stability and drift, will negatively impact data quality in certain cases such as spectroscopy and faint-target imaging requiring long exposure times, for which post-processing may not be able to compensate for lost light or further image blurring due to unintended target motion during exposures.
In addition to suppressing the background noise as much as possible, another way to enhance the data quality is to reduce the Point Spread Function (PSF) to reach its diffraction limit in the widest wavelength range. A tight, concentrated image size not only helps minimize background noise, but also enables as much light as possible to pass through the narrow slits of spectrographs such as the Echelon-Cross- Echelle Spectrograph (EXES) (Richter et al., 2003, 2018), the Faint Object infrared camera for the SOFIA Telescope (FORCAST) (Adams et al., 2004, 2010; Ennico et al., 2006; Herter et al., 2013, 2018) and the High-resolution Mid-infrared Spectrometer (HIRMES) (Cothard et al., 2018), or to fall on a single pixel. Several factors contribute to image size. Some are unavoidable consequences of physics, such as diffraction, while others can be restricted through requirements and controlled, such as jitter and pointing accuracies. Jitter captures high frequency motions that blur on short (≤1s) timescales, while poor pointing accuracy and stability act as blurring agents for longer exposure times. These longer timescale considerations are especially relevant to spectroscopy, an observing mode for which light needs to be maximally concentrated so as to optimize the amount of light falling inside a spectroscopic slit width. Various sources that contribute to blurring the point spread function are given in Table 1 and detailed in Sec. 4. The first two factors are inherent (e.g. pure physics) and generally must be accepted as is (although shear layer seeing could conceivably be reduced by additional modification such as a fence or a ramp design modification in telescope aperture system). The last four items are essentially artifacts injected into the system whose effects, to varying degrees, can be reduced by implementation of appropriate mitigations. For the analysis presented in this paper, the first three items listed in Table 1 are used to set the requirements for a point source image size, defined as the size of an image taken over an exposure time of ∼1s. While the other sources are also constrained by requirements, they are not considered part of the point source image size budget of a 1s exposure because they are affected by factors that act on timescales longer than 1s. The underlying motivation for this approach is that the pointing-related sources of blur which act on longer timescales that span multiple exposures can be removed by post-flight processing techniques in many cases (e.g. via centroiding and re-alignment of images before final coadd, for example).
| Source | Comment |
|---|---|
| Diffraction | Assumes a circular aperture, includes effects of central obscuration |
| Shear layer seeing | Dominates over diffraction for wavelengths ≤ 5 microns |
| Jitter | Includes any high-frequency (≥1Hz) random motion that injects scatter about a specific pointing centroid |
| Pointing accuracy | The distance between the science instrument boresight to the commanded position |
| Pointing stability | The rms of random motion about the SI boresight centroid position after initial target acquisition |
| Pointing drift | The systematic motion of the SI boresight centroid position after initial target acquisition |
This approach in image size requirement definition specifically, limiting the PSF size computation and development of the requirements text to only the effects of jitter, shear-layer seeing and diffraction does allow for the undesirable possibility that some long-exposure images may end up with PSF sizes exceeding the requirement. Additional PSF blur by pointing inaccuracies can occur if post-flight processing is unable to remove the additional blur from the data. One example of such a situation would be poor pointing during spectroscopy acquisition light lost as a result of the target partially moving out of the slit which cannot be compensated, after-the-fact. Another example would be the imaging of a source so faint that it cannot be seen in any single exposure, taken under imperfect pointing conditions. Under such circumstances, the object would likely be located in different pixel locations from one image to the next. Because a robust centroid of the invisible or faint target cannot be robustly determined in each image, no re-alignment could be performed, so the images would just have to be stacked under the assumption that no movement had occurred. The resulting image (or spectrum) could have a PSF that is larger than the image size requirement since the additional blurring was caused by sources acting on timescales longer than 1s.
3. Data Collection
As we focus our attention on the observatory technical performance, both the in-flight science data and the complementary engineering data sets are used efficiently to measure and characterize key parameters of interest.
3.1. Science data
In-flight data collected for science purposes provide a valuable asset for the analysis and characterization of the observatory performance. SOFIA generates large amounts of observed and processed science data that is expected to remain scientifically relevant far into the future. A detailed description of the science data collection and archival process is beyond the scope of this publication, so in what follows we outline only the high level elements in such process. A SOFIA Science Data Management Plan is in place to describe the processes, systems responsibilities and implementation for collecting, processing, insuring quality-control, archiving and dissemination of science data acquired by the SOFIA Observatory and derived science mission products. The plan also provides expertise to support the scientific community’s use of the SOFIA data, throughout the operational lifetime of the observatory and plans for securing data at end of mission.
Science data obtained by SOFIA’s science instruments are transferred from the aircraft to the SOFIA Science Center (SSC). From there, the Principal Investigator (PI) can access the data for his/her observation. Data is accessible by the general public at the end of an associated exclusive-use period for that data. Since the science instruments write their data in well-documented standard formats (e.g. Flexible Image Transport System (FITS), Continuum and Line Analysis Single-dish Software (CLASS)), science data can be directly imported to standard reduction packages like IDL or IRAF without any conversion or re-processing.
The science data is archived in the Data Cycle System(a) (DCS), to be transferred to IRSA in 2019. The DCS (Krzaczek, 2014; Shuping, 2013, 2015) provides the portal through which General Observers (GO) and scientists using archive data acquire all SOFIA data products. The DCS includes data calibration pipelines for each SI that reduce the raw data into useable and calibrated formats. All of the raw and processed science data is then archived by the DCS for future reference. The DCS provides users with the capability to search the archive and submit queries to receive the science data. The data are protected during an exclusive-use period during which the DCS permits access to the data by only appropriate users (typically, 1 year for data related to General Observer observations, but see the SOFIA Science Utilization Policy for exclusive rights period designations for other types of observations, available at the project website).(b)
3.2. Engineering data
In addition to science data, SOFIA generates large amounts of raw and processed engineering data that must be retained to support analysis and assessment of the observatory performance far into the future. Housekeeping (HK) data provides detailed information about the functioning of the observatory systems, as well as a command log for the duration of the mission. These raw data products are input into post-flight processing tools that extract information to generate plots and reports for users.
3.2.1. Raw data products
The primary SOFIA raw data products include the HK parameters stored in archive files and the command and response logs generated by the Mission Communications and Control System (MCCS). In addition, the TA imager data represent a large volume of information that must be accessible for post-flight analysis efforts. A variety of planning products and configuration files document the observatory conditions for the mission and ancillary system status. A summary of the raw data products can be found in Table 2.
| Data product | Type of product | Summary |
|---|---|---|
| HK archive files | Raw Data | All housekeeping data parameters, stored in binary *.ark files. |
| DAS archive files | Raw Data | Data Acquisition System (DAS) record of non-HK data including all required parameters from the aircraft avionics systems and any sensor/system that is not part of MCCS, stored in binary *.ark files |
| Integrated command logs | Raw Data | Record of all Sofia Command Language (SCL) commands and the associated final responses throughout each SOFIA operation in an ASCII text file. |
| Ephemeris files | Planning product | Position and timing data necessary for tracking non-sidereal objects, stored ASCII text file. |
| FMI science flight plan files | Planning product | Flight Management Information (FMI) system records a collection of position/waypoint files, weather information, and associated planning files. |
| MCCS GUI log files | Raw Data | Detailed command and response logs for each MCCSa Graphical User Interface (GUI) workstation, stored in ASCII text files. |
| TA gyroscopic data | Raw data | Data from the three low-noise fiber optic gyroscopes are recorded and used as fast feedback sensors to stabilize the telescope inertially. |
| TA imager data | Raw data | Image files collected by the WFIa, FFIa, and FPIa,b at their respective acquisition rates, stored in binary *.ark files. |
| MCCS configuration files | Configuration file | Collection of pre-determined inputs to configure the MCCS for observations, stored in *.xml files. |
| User comment files | Raw data | User comments stored in ASCII text files. |
| Mission ID file | Planning product | The unique mission identification number, stored in ASCII text file. |
| Mission Information file | Planning product | Contains information unique to each SOFIA mission, such as, the Science Instrument, flight times, crew names, as well as flight data configuration information, stored in a *.minfo text file. |
| SI configuration files | Configuration file | Collection of pre-determined inputs to configure the SI for observations, stored in *.xml file(s). |
| SMA configuration file | Configuration file | Collection of pre-determined inputs to configure the Secondary Mirror Assembly (SMA) for observations, stored in *.xml file. |
| SI data files | Raw data | Each Science Instrument produces observational data during flight that is recorded on the Archiver. Typically recorded in FITS format, however, each SI may record ancillary data per its respective Interface Control Document (ICD). |
| WVM engineering files | Raw data | Water vapor burden information, stored in a collection of data files containing the record of Water Vapor Monitor (WVM) observations in flight. |
3.2.2. Processed data products
After each SOFIA mission, the raw data is processed using the Data Handling Tools (DHT); the primary products are the outputs of the Mission Operations Automated Processing (MAP) tool. Batch processing is performed on the raw subsystem data to produce summary plots of the data. These sets of plots illustrate the overall system performance and detailed subsystem outputs for review, they are used for data analysis, troubleshooting and trend analysis. They provide a high-level set of general-interest data as well as lower-level subsystem analyses.
The raw and derived post-flight data is also used to create a series of post-flight reports. The Mission Director (MD) composes a detailed, standardized, and integrated report that is quickly uploaded and distributed to the SOFIA team. More detailed information is included in Leg Reports that provide tracking information for each observing leg of the flight. This documents the actual flight path of the aircraft versus the flight plan as well as the data recorded and any issues generated on each leg.
A summary of the standard observing metrics is also included in the processed data set. These include the Research Hours (RH), Science Flight Hours (SFH), and Data Collection Time (DCT) recorded for each flight. This data is used to calculate the observatory efficiencies and overall performance.
In addition to documenting the mission and addressing any issues encountered during the flight, the processed engineering data is used to track trends in the observatory performance. Trending results may indicate the need for procedural or system changes to the observatory. Trending data may also be frequently used to understand how environmental conditions such as aircraft positions and attitude, or TA temperatures may have affected operations of the observatory or the quality of science data. Trend data for each flight will be accumulated for further long-term trend analysis to detect degradation of observatory performance over time.
Experience with use of the processed data by SOFIA data analysts led to the addition of the Core Housekeeping list. Users found it inefficient to always have to unpack large amounts of flight data in order to access individual HK items. Thus, a core list of the most commonly used items was created. More than 300 HK parameters are included in a tab-delimited ASCII table that includes the time stamp for each row of data, the value of each HK item and its age relative to the time stamp for that row. The age indicates how long it has been since the MCCS last updated the parameter. The compressed Core HK list is roughly 50 Mbytes in size for a typical flight, which is much smaller than having to download all of the HK data. The DHT can then be used to extract the specific parameters over the required time range.
3.3. Verification & validation
The Verification and Validation (V&V) plan for the SOFIA Program is divided into four categories: observatory, airborne platform, science mission operations (SMO), and science instruments. The V&V plan for the observatory covers the V&V of the requirements placed at the observatory level. The observatory is designed to accommodate a wide range of Science Instruments (SIs), which makes V&V of every possible combination and configuration impractical. The approach to V&V of the observatory was to verify the versatility of the core observatory capabilities, such as pointing and tracking, over the required range. The observatory V&V plan specifies the verification method (test, analysis, inspection, demonstration, or combination of methods) used for each individual requirement of the SOFIA System Specification. When the test verification method is used, the results must meet pre-determined exit criteria to be accepted. Validation occurred through complete mission demonstrations and the various science gathering activities. The human interface (scientist involvement) has been critical to validating that the system operates as it was intended to.
4. Telescope Technical Performance
Using the data collected and stored in the archive, we can (as already mentioned) determine the technical performance of the observatory after each flight and see trends over time. In the following sections, we report on the top level technical performance of the observatory at the time of full operation capability.
4.1. Pointing stability
The pointing stability of the SOFIA telescope is critical to ensure the target remains positioned favorably long enough for a typical exposure for narrow-slit or faint-object observations. Pointing stability can be assessed using star centroids in both the focal plane imager and imaging science instruments. Both methods yield similar results.
For the Focal Plane Imager (FPI), the centroid of each star with a defined area of interest (AOI) is archived for each image and stored as housekeeping data. All stars used for tracking require an AOI, thus this information is always available when tracking on the FPI. Typical exposure times in the FPI are in the range of 500ms to 2500ms. The requirements for an observation to be suitable to measure pointing stability are that the observation lasts at least 15min, the tracking is done in the FPI, and there are no dithers or tweaks during the observation. Chop and nods are allowed during the observation. If the source with an AOI around it is not at the boresight, the measurement is done between Line of Sight (LOS) rewinds, but if the source is on the boresight, the measurement is done through LOS rewinds, as the centroid location on the FPI should not change. These requirements ensure that the expected behavior of the centroid is to remain at a constant pixel location on the FPI over the entire observation.
After a suitable observation is identified, the FPI x- and y-positions of the AOI centroid are extracted from the housekeeping data. From these data, the mean x and y values are calculated, excluding measurements that exceed 1.2 times the standard deviation. This culling is necessary to exclude centroid measurements when the telescope had not yet settled after a nod maneuver. The value of 1.2 was picked as it proved through practice to be the best value to maximize the available data while excluding any obvious bad data while moving. The mean x- and y-positions are then subtracted from each measurement, resulting in a time-series of x- and y-positions with a mean of zero. A first-order polynomial is then fit to both time-series. The quadrature sum of these two slopes is the total observed radial drift rate, the systematic drift. The systematic drift is subtracted from the data, and the root mean square of the residuals is the final pointing stability value for the observation in FPI pixels.
The steps above produce a root mean square (RMS) stability measurement in FPI pixels. This is then converted to arcseconds on the sky from the plate scale, P, which is determined from
The root mean square of the residuals was calculated for over 200 measurements from 2014 through 2017, and the median of these values which we define as the pointing stability, is 0.17′′. This value is valid regardless of the observing mode, including sidereal and nonsidereal targets, chopping and no chopping, on- and off-axis tracking. The project has a requirement that the pointing stability is better than 0.4′′, and that is met easily. The worst pointing stability ever recorded was around 0.52′′, and was due to tracking on a source that was very saturated on the FPI imager. The raw data and rolling medians of the pointing stability are plotted in Fig. 2. There is a slight improvement in the sidereal measurements as a function of time. While no observatory improvements specifically targeted pointing stability at exposure times greater than 1s, gradual improvements in high-frequency vibration dampening (Keas et al., 2012; Graf et al., 2018) has likely helped pointing stability as well. Limited measurements using the FLITECAM(c) and HIPO(d) science instruments yield similar results to the FPI.
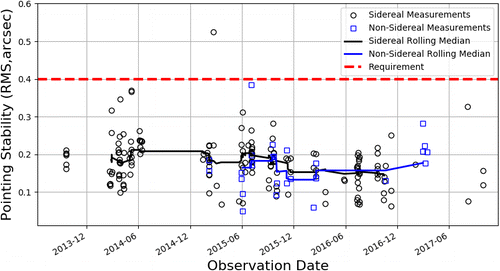
Fig. 2. Measured pointing accuracy for sidereal and nonsidereal targets with a rolling median of 20 and 10 measurements, respectively.
4.2. Pointing drift
The ability to maintain a pointing over the duration of the exposure is important. Pointing stability is the scatter around the stationary centroid position, while pointing drift is the systematic motion of the entire centroid cloud over time. Drift is measured both with centroid information from the FPI as well as centroid information from imaging science instruments.
Pointing drift as measured in the FPI is a byproduct of the pointing stability calculation. The method for determining pointing stability is discussed in Sec. 4.1, and the quadrature sum of the slopes of the fit to each component is the systematic drift, converted to arcseconds on the sky by Eq. (1). For all measurements in which the target was a sidereal source, the median systematic drift observed in the FPI is 0.06′′h−1. When the target is a non sidereal source, such as a planet or asteroid, the median drift is 0.19′′h−1. All the FPI drift measurements are plotted in Fig. 3.
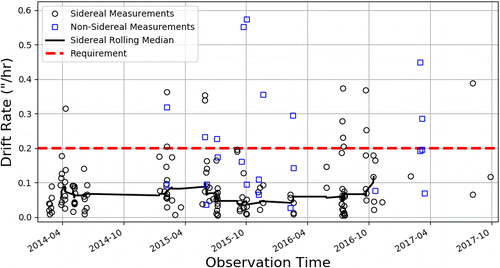
Fig. 3. Measured systematic pointing drift as measured by the focal plane imager. Sidereal measurements include a rolling median of 20 points. There are an insufficient number of nonsidereal measurements to plot the rolling median.
When the drift is measured by imaging science instruments, the results are very different. The conditions to measure drift with an imaging science instrument is rare. The observation must be long enough to detect any drift and the signal of the source must be strong enough to detect with short exposures. Typically, bright sources are not observed long because the signal is high, and long observations are usually of faint objects that require a long exposure to detect. The available observations to measure drift are usually during point and stare observations of transient events such as an occultation, or a fortunate coincidence of a bright source in the field of view of a faint target. The method to determine the drift with these rare observations is similar to the FPI, and the centroid of a source is tracked on the imaging array over the duration of the observation. Only 11 measurements of drift with science instruments are available from historical observations. The median of these is 0.38′′h−1, with a maximum of 0.71′′h−1. The drift is seen with four different instruments, and a similar drift was seen by both FLITECAM and HIPO when they were mounted simultaneously, ruling out any instrument-specific effect. This large discrepancy between the FPI and SI measurements of the drift implies something different is happening between the two ray traces. The ray traces start to diverge at the tertiary mirror, where the dichroic tertiary reflects the light to the science instrument and the fully reflective tertiary behind the dichroic reflects the remaining light to the FPI. The FPI also has folding mirrors to adjust focus independently. There is evidence of correlation between the temperature in the cavity and the drift magnitude, but the exact cause of the discrepancy has yet to be determined.
Figure 4 shows an example of drift as seen by the FLITECAM instrument on SOFIA flight 243, which occurred on September 29, 2015 UTC. The top panel shows the position of the centroid in the x- and y-directions on the FLITECAM detector array. The bottom panel shows the total radial displacement of the centroid from the initial position over time. Also plotted in the bottom figure is the temperature of the tertiary mirror, which is thought to potentially play a role in the observed drift. The total slope of the radial drift is 0.88 pixels per hour, which translates to 0.41′′h−1 on the sky. During the same observation period, the tracking star on the FPI had no detectable drift.
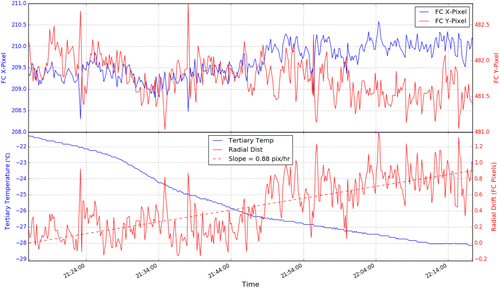
Fig. 4. Observed centroid drift using the FLITECAM instrument on the night of September 29, 2015 UTC. The top panel shows the individual x- and y-components of the centroid of the source on the FLITECAM array over the course of the observation. The bottom panel shows the total radial displacement of the centroid from the starting location, in pixels (1 pixel is 0.475′′). Also plotted on the bottom panel is the temperature (in Celsius) of the tertiary mirror of SOFIA which is thought to play a role in science instrument drift.
The observed median SI drift rate of 0.38′′h−1 is not problematic for most instruments. Imaging instruments can always stack their images with varying spatial offsets, provided a source can be detected moving between the start and end. For many of the spectroscopic instruments, observed drift rate is not detectable due to the slit width and/or the pixel size of the detector. The only instrument for which the observed drift might be an issue is with the smallest slit available (1.2′′) with EXES. Over an hour of observation with the smallest slit, the flux lost due to drift is equivalent to 5min of integration time. The SOFIA program has set a goal to reduce the observe drift rate to less than 0.2′′h−1, provided the cause for the drift can be determined.
4.3. Pointing accuracy
The ability to point the telescope accurately is particularly important with SOFIA, as infrared targets observed with the science instrument are not always detected at visible wavelengths on the guide cameras. Some infrared targets can only be detected with the science instrument after a long exposure, and with time as a premium on an airborne observatory, getting the pointing correct the first time is critical.
Science instruments determine their boresight at the start of each flight series, and it is generally static. Therefore, pointing accuracy can be evaluated by examining the position of the SI boresight projected onto the FPI. While there is some pointing drift between the SI and the FPI (discussed in more detail in Sec. 4.2), this effect on initial pointing accuracy is negligible.
Pointing accuracy is measured from archived FPI images and housekeeping data. Astrometry software is used to identify the stars in the field of the FPI, and then determine the position of the SI boresight pixel on the FPI. If chopping is active, the software will ignore one chop beam. The software uses avionics as an initial guess, and uses only the stars within 1.5∘ of that guess to greatly reduce processing time. At least three unsaturated stars are required for a solution. The pointing accuracy is then determined by the radial distance between the SI boresight determined from astrometry and the position recorded in housekeeping data by the MCCS. The uncertainty in the astrometric position is about 0.2′′, which was determined by using surrounding stars to calculate the astrometric position while the boresight was centered on a star of known coordinates and proper motion.
Assessment of pointing accuracy occurs after the telescope operators have acquired the target and handed control of the telescope to the science instrument. The handoff is recorded as a flag in the archive, and a pointing accuracy measurement is typically averaged over the following 30s to avoid any temporary blips. If an astrometric solution cannot be obtained, the accuracy can also be determined from the centroid of the visible target, provided the target is detected on the FPI and the commanded position is the source itself. In this case, the accuracy is determined by the radial offset of the centroid of the source and the SI boresight pixel.
The measured pointing accuracies can have a large variance. Pointing accuracy is the best when the target is visible on the FPI and direct tracking is possible. Figure 5 shows a histogram of all the measurements in each tracking mode. In this on-axis case, the median pointing accuracy is 0.25′′ with asymmetric 1-sigma error bars of [+0.32′′,−0.10′′]. The asymmetric error bars are due to the non-Gaussian distribution of the radial measurements. When the object used for tracking is not on the boresight (off-axis tracking), the performance degrades to a median pointing error of 0.41′′ with asymmetric 1-sigma error bars of [+0.48′′,−0.2′′]. In the very rare occasions where there is no visible source available on the FPI for pointing corrections, the FFI is used, and typically has around 0.5′′ of pointing error.
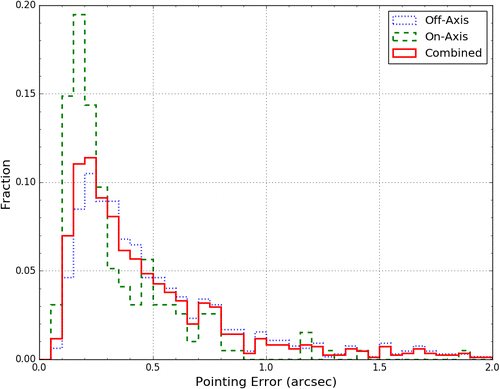
Fig. 5. Pointing accuracy by tracking method.
The degradation of pointing performance under off-axis tracking is due to several factors. The conversion between the inertial reference frame and the equatorial reference frame on the sky uses 1 or 2 stars on the FPI. The pointing error degrades as a function of the distance move from this initial position. Off-axis tracking is used more often in confused regions, and the centroid of the tracking star can be affected by nearby neighbors, degrading the pointing accuracy. Finally, pointing accuracy is degraded after chopping is initiated because the chopper accuracy is never perfect and varies as a function of temperature and chop direction. This can lead to the chop amplitude varying by up to 1′′ and the angle by up to 10∘. Solutions to mitigate all of the above factors have been identified and will be implemented as soon as possible. One of the solutions is to continuously feed the observed chop beam position back into the calculation instead of only calibrating at the start of an observation. Another solution being considered is to use multiple stars in the field for tracking, which would reduce the pointing error. The goal is to reduce the pointing error to less than 0.3′′ for any tracking state using the FPI.
4.4. Image quality
4.4.1. Image size and shape
The size and shape of the airborne point spread function (PSF) at optical and near-IR wavelengths is affected by many different variables. We know from previous experience with the Kuiper Airborne Observatory (KAO) (Dunham et al., 1987; Elliot et al., 1989) and current experience with SOFIA that there are four primary factors that degrade airborne images, each involving several variables:
| • | Shear layer turbulence (predominant for optical images on SOFIA). The turbulent flow in the shear layer produces turbulent variation in density, which is proportional to refractivity, the refractive index of the air minus 1. This causes a spatially and temporally variable optical path difference resulting in a degraded wavefront. Factors influencing shear layer image degradation include: (i) Altitude and static air temperature (image size varies with static air density). (ii) Mach number. Aero-optical experience suggests a Mach squared dependence (Rose, 1987). This is difficult to detect due to SOFIA’s limited operational Mach number range. (iii) Wavelength. Turbulence induced wave-front errors traversing the shear layer are wavelength-dependent. | ||||
| • | Cavity seeing. Convective cooling of thermally massive warm components in the telescope cavity can result in refractive index variations similar to those in the shear layer. Factors influencing cavity seeing include: (i) Temperature difference between warm TA components and cavity air, especially early in a flight (see Fig. 8 below). (ii) Leaks through the pressure bulkhead separating the cavity from the cabin. The double-walled scheme implemented in the SOFIA pressure bulkhead effectively controls this factor. (iii) Altitude. Image size will vary with static air density, but since thermal disequilibrium is most pronounced early in a flight (typically also at low altitude) this variable will be difficult to isolate. | ||||
| • | Optical aberrations. Solid focus control is crucial in any effort to understand more subtle image quality factors. We are able to study aberrations in general and focus in particular without impact from other factors by use of the HIPO Shack-Hartmann test capability (Dunham, 2012). (i) Defocus. The linear calibration with temperature sensors in the telescope is very effective in maintaining a good focus. (ii) Coma. Misaligned optics produce coma. This is usually not a big issue. (iii) Astigmatism and trefoil. These are usually produced by optics stressed by their supports. Astigmatism is the result of a different radius of curvature in one direction compared to the orthogonal direction, and trefoil is a 3-fold symmetric version of astigmatism. A temperature-dependent astigmatism in the SOFIA TA has been detected, so some optical element may be thermally stressed. (iv) Optical figure errors. The SOFIA optics are of good quality and are made from low expansion materials so these factors are small Krabbe (2000). | ||||
| • | Image motion on various timescales. Tracking errors are too slow to be included in the image quality budget but high-speed TA structural vibrations are included. We have been able to study this area without impact from other factors by using high-speed imaging to resolve the image motion. (i) Altitude (ii) Elevation angle (iii) Active Mass Dampers (AMDs). These can very effectively damp some of the major modes in the 50–70Hz range but are not effective in damping the 90Hz SMA/spider modes. There is also a high-frequency astigmatic bending mode of the primary mirror that the AMDs effectively damp (Greiner et al., 2016). (iv) At lower frequencies, the efficacy of the dynamic Flexible Body Compensation (FBC) system. | ||||
The many contributions to the airborne PSF size all add in quadrature. It is essential to control as many of these as possible, and independently measure as many others as possible. This paper is not intended to be a comprehensive report on all of the topics outlined in the previous section, but some of the Shack–Hartmann results are documented in the next section. Jitter has been a major research topic, including the effort to develop the Active Mass Damper (AMD) system and evaluate its performance (Lampater et al., 2013; Lammen et al., 2018; Keas et al., 2010, 2012; Graf et al., 2018; Reinacher et al., 2011; Temi et al., 2012; Kaercher, 2014; Reinacher et al., 2014, 2016, 2018).
4.4.2. Shear layer characterization
High-speed images of out-of-focus star images using the Super-Fast Diagnostic Camera (SFDC) (Wolf et al., 2008) have been used to characterize the temporal and spatial scales of shear layer and cavity turbulent structures.
With the SDFC, the tool became available to resolve and even “freeze” potential turbulent shear layer structures in time. Based on Computational fluid dynamics (CFD), the passing frequency of potential coherent structures in the shear layer is expected to be around 250Hz requiring frame rates of about 1000 fps to resolve and about 2–3k fps to freeze them (Engfer et al., 2012; Barad et al., 2016). Depending on the sub-array size, the SFDC offers frame rates from about 750fps (90×90 Pixel) to 5k fps (one Pixel row with vertical binning).
A series of defocused star images were taken during a TA characterization flight in December 2011. The image series were taken at the telescope cross-elevation XEL=0∘ and +2∘. The motivation for the latter case is that the signal beam passes closer to the cavity leading edge. This would increase the chance of a coherent structure detection because there is a possibility (under the assumption they exist as predicted by CFD) they might decay shortly after passing the cavity leading edge.
Animations generated from the image series show white spots moving in flow direction but there is no adequate sign of coherent structures in the shear layer.
As to the turbulent shear layer structures, an assessment of the size and speed is done based on several animations generated from the acquired data. Figure 6 shows an example where two white spots (A and B) are visible at the same time. From the animations, the derived convection speed values for turbule A and B are below the empirical value of the averaged shear layer convection speed which is about 150m/s. Due to this fact and given that the entire light path is sampled it seems that the turbules move in the region of the cavity on inner side of the shear layer. Following the flow path of the turbules, it appears that the flow over the cavity has an inclination to the horizontal. It enters the image at higher elevations and leaves the primary mirror area at lower elevation angles. This is in accordance with the CFD simulations where stream lines feature the same inclination while passing the cavity leading edge (Engfer et al., 2012) (Fig. 7).

Fig. 6. Defocused star images. path movement is highlighted by yellow arrows in the initial frame, white spots are highlighted by red arrows in every frame (Engfer et al., 2012).
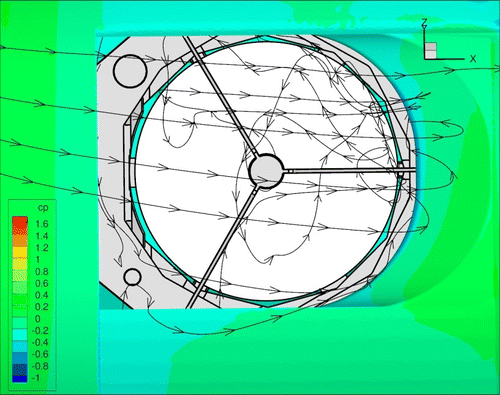
Fig. 7. Contour plot of the pressure coefficient value over the aircraft skin in combination with stream lines over the cavity as predicted by CFD simulation (41kft, Ma=0.85). (Engfer et al., 2012).
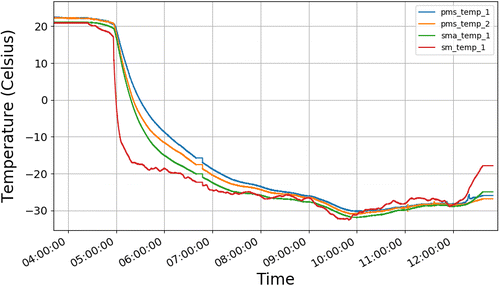
Fig. 8. Time history of Primary Mirror and Secondary Mirror Assembly temperatures on a typical SOFIA science flight. Telescope temperatures are plotted during the entire flight from take-off to landing from the reading of several sensors located on the PM (pms_tmp_1; pms_tmp_2) and SMA (sma_tmp_1; sm_tmp_1).
Thanks to defocused star images taken by the SFDC, an assessment of the temporal and spatial shear layer scales was possible. The aero-optical properties of the shear layer are characterized by isolated “turbules” (size from 0 to 23cm) moving with speeds of about 80–130m/s most likely in the cavity inner side of the shear layer where the temperature is higher and hence the density is lower. There is no adequate proof of similar coherent structures in the cavity shear layer.
A spectral analysis based on pixel intensities was performed to detect potential peaks in the frequency range around 250Hz where the passing frequency range of coherent structure is expected. For this purpose, exposed pixel positions were picked at several positions on the mirror as well as on the mirror edge. Results from the spectral analysis show that no peaks around 250Hz are present. However, there are several peaks below 100 Hz. The frequencies coincide very well with the vibration modes of the telescope. Intensity spectra of SFDC pixels provide a method next to the centroid method for TA vibration mode validation.
4.4.3. TA focus control
As mentioned in the previous paragraph, a solid focus control during science flights, where significant telescope temperature changes occur in the first few hours, is critical to reduce the image size contribution due to defocus.
The TA was designed and constructed to accommodate a wide variety of SIs. This included a generous range of 1.2m for the telescope focal plane location (back focus). Most of this back-focus range extends forward from the SI mounting flange. Focus adjustment is obtained by commanding a mechanism that moves the secondary mirror along the centerline of the TA. The maximum range of this adjustment is ±5mm, and has 0.001mm resolution. Due to the optical power of the secondary mirror, this range is more than sufficient to cover the entire originally specified 1.2m range of possible focal plane location. Each SI has a unique internal optical design, including a back-focus distance.
Although the SOFIA telescope is constructed mainly of carbon fiber reinforced polymer (CFRP), some of the optics support components are metals. Therefore, some temperature dependence of focus setting on temperature is expected. Given the optical design of the telescope, the focal-plane location is very sensitive to the Primary Mirror (PM) and Secondary Mirror (SM) separation. With the SM near the center of its focus control range of ±5mm, a small change of PM–SM separation Δt causes the focal plane location (back-focus, distance from SI flange) to move. Ground tests and flights have shown that the focus setting at about +20∘C differs from that at −20∘C by at least about 600microns.
In addition to changes in PM–SM distance, the only individual TA component that might contribute in some other significant way to focus drift as temperature changes would be the secondary mirror itself. If the SM radius of curvature changes with temperature, the optical power of the SM changes, and therefore the TA magnification factor is affected. A significant temperature increase would increase the radius of curvature, weakening the secondary mirror optically, and cause the focal-plane to move toward the SI flange.
The SOFIA TA temperature dependence of focus has been evaluated in several ground line operations and in-flight using the HIPO instrument in its Shack–Hartmann (S–H) test mode. This technique allows for a proper evaluation of all optical aberrations of the telescope, and their dependence on temperature, elevation angle, optics alignment changes, etc. The time history of primary mirror and secondary mirror assembly (SMA) temperatures on a typical flight is shown in Fig. 8. The temperature differential between PM and SM is greatest during the first hour after the TA door is opened. After the TA cavity has been exposed for about two hours, the TA cavity becomes approximately isothermal, with the typical cavity temperature determined by the aircraft cruise altitude.
To check for contributions to the temperature effect on focus, temperature values from several TA sensors were collected for the times that the S-H measurements were made. S-H determined focus values versus temperature of the various TA components are shown in Fig. 9. The airborne and ground-based S-H results are consistent with a linear relationship between focus and the temperature from a sensor on the SMA housing (SMA T1). These combined ground-based and airborne data span a temperature range of over 60∘C.
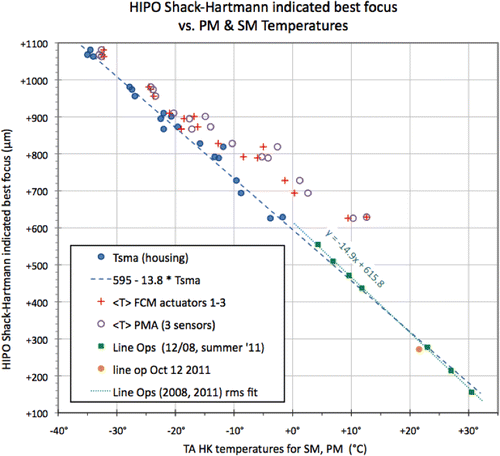
Fig. 9. S–H results from several flights plotted versus SMA T1, 〈Tpm〉, and the average temperature of the focus actuators #1–#3 in the Focus Centering Mechanism (FCM). Eight S–H results from summer and winter line operations are also plotted versus SMA T1. Linear fits are shown for the overall SMA T1 dependence, and for the line operation results alone (Dunham, 2002).
In summary, sensitive HIPO Shack–Hartmann measurements of defocus during line operations and flights show that the telescope cavity ambient temperature has a significant effect on focus. This can be compensated by moving the secondary mirror at a rate of −13.8μm/∘C of temperature change, as read from the sensor SMA T1 This single temperature value is apparently sufficient to accurately set or change the focus to compensate for the temperature effect. The primary mirror temperature does not seem to play a significant role, even when the PM is far from equilibrium with cavity air. A general equation for focus setting that includes both the temperature effect and SI back-focus has been established. If not compensated, temperature changes can cause defocused image diameter change at a rate of 0.7arcsecond/∘C.
4.4.4. Image size measurements
The size and shape of the airborne point spread function (PSF) is mostly affected at optical and near- and mid-IR wavelengths. In this respect, science observations that require instruments that operate in the image size minimum between shear layer scattering at short wavelengths and diffraction at long wavelengths (Fig. 11) will benefit most from a reduced image size.
The image full-width at half-maximum (FWHM) at optical (HIPO) wavelengths is dominated by shear layer seeing generated by density fluctuations occurring in the shear layer flowing over the cavity in front of the telescope. The image size is dependent on wavelength and altitude as expected. The smallest images occur at long wavelengths and high altitude. Since wave-front errors, induced by density fluctuations traversing the shear layer are inversely proportional to λ, the seeing degradation declines with increasing wavelength (Erickson & Dunham, 2000). Also, at higher altitude, lower air density reduces the shear layer seeing. This behavior is characteristic of shear layer image formation (Erickson & Dunham, 2000; Banish et al., 1990). The image FWHM is worse early in a flight and improves over the first 60–90min to the value it normally has at the initial altitude. This effect is likely due either to cavity seeing or a more complicated temperature-dependent focus during the very rapid TA cool-down following takeoff. The encircled energy curves are very similar to the familiar curves from the KAO showing the broad wings characteristic of airborne optical PSFs (Dunham & Elliot, 1983; Elliot et al., 1989).
The wavelength dependence seen across the limited HIPO wavelength range continues out to 3.6 microns. Assuming 1.2′′ rms jitter, the remaining ∼2′′ FWHM at 3.6 microns seen in the FLITECAM data is due, most likely, to a combination of astigmatism, remaining jitter, and other smaller factors. At mid-IR wavelengths, the shear layer seeing becomes progressively less important, and jitter, in conjunction with the high-frequency astigmatic bending mode of the primary mirror and diffraction, dominate the image size. At wavelengths longer than ∼45μm, the image size becomes limited by diffraction.
Figure 10 (left) shows pointing stability (jitter) achieved with SOFIA in a 2017 flight. The measurement, made by recording a star with the FPI in high speed mode, presents current best performance of the pointing and control system with the AMD system nonactive. A detailed description of the parameters and the implemented improvements in SOFIA’s control system concerning this data set are described in Graf et al. (2017, 2018). The bright star was recorded for 30 s at a sampling rate of 400 Hz, but for clarity Fig. 10 shows only one second period. Measured centroid motion is clearly visible and is consistent with RRMS jitter of 0.8′′.
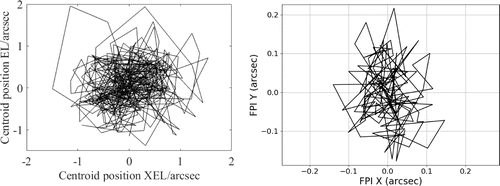
Fig. 10. Left: Best performance jitter measurement. Measured centroid motion of best performance recorded in a SOFIA flight in 2017 using the FPI in high speed mode. Data represents centroid position in a 1s time series sampled at 400Hz. The rms value, evaluated over the longer 30s measurement, is 0.8′′. The frequency domain data associated with this recording is presented in (Graf et al., 2018). Right: Pointing stability as recorded in a recent (6/26/2018) flight during the SOFIA deployment in New Zealand. The plot is made from 20s of centroid data, where each data point is from a 600ms integration. The RMS stability (tracking error) is 0.093′′.
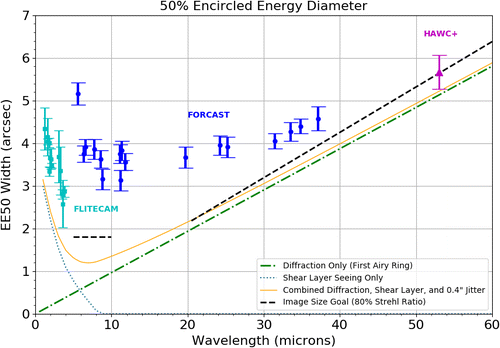
Fig. 11. Fifty percent encircled energy diameter of SOFIA images at various wavelength with 3 instruments. Reference lines are also included to show the predicted contribution from the shear layer seeing, diffraction, and 0.4″ jitter Dunham (2002). A goal of the project is to produce image sizes consistent with the black dashed line, pending jitter and aberration improvements.
By comparison, optimum performance of image stability obtained with the KAO’s 0.9m telescope reached an RMS of ∼0.4′′−0.6′′, with more typical pointing stabilities obtained without tuning up the pointing system at RRMS jitter >1′′ (Elliot et al., 1989; Erickson & Dunham, 2000). Of course, the SOFIA telescope with its large size (2.7m) and the carbon-fiber constructional material is exposed to much higher aero mechanical forces which severely affect image motion. In this respect, the pointing stability of the SOFIA telescope is regarded as a very good achievement, and is comparable or better to that of the KAO during routine operations. When the AMDs will be integrated in routine operations and planned developments in the SOFIA control system are in place, the jitter contribution will be further reduced (Greiner et al., 2016; Graf et al., 2018). Figure 10 (right) shows tracking errors in a recent SOFIA flight. A guide star is tracked using the focal plane guiding camera in a 20s observation. Each centroid is acquired with 0.6 s of integration time. The excellent RMS stability is 0.093′′.
Table 3 summarizes the major contributors to image degradation present on the KAO. The magnitude of the effects that contribute to the overall long-exposure KAO image size is presented along with their timescales. When compared to the same parameters on SOFIA, the amplitude of the effect in image degradation is significantly reduced despite the challenge of a larger, heavier and more flexible telescope.
| Effect | Estimated magnitude (arcseconds) | Estimated time scales (ms) |
|---|---|---|
| Optics | >1 | — |
| Tracking | >1 | 100–∞ |
| Vibration | ∼2 | 10–100 |
| Cavity Turbulence | >1 | 10 |
| Shear Layer | ∼2 | 0.3 |
SOFIA’s image quality is tracked by calculating the diameter corresponding to 50% encircled energy as well as the ellipticity of the point spread function. There are currently three SOFIA instruments capable of imaging in the infrared: FLITECAM, FORCAST, and the High-resolution Airborne Wideband Camera-plus (HAWC+) (Harper et al., 2000; Harper et al., 2018). Data from flux calibrators used by these instruments are used to calculate image quality, as these targets are bright and provide good signal.
The 50% encircled energy diameter is calculated from level 2 data (corrected for instrumental artifacts). The center of the point spread function is first determined by fitting a 2-D Moffat function. A curve of growth is then generated from the center by summing the values of all pixels inside each radius. The intention is to use the curve of growth to identify the radius corresponding to half the total energy enclosed by an aperture. For FORCAST data, the aperture radius is 25 FORCAST pixels, or about 19′′. The median of the sky background is subtracted from the source aperture, resulting in total detected flux. However, to obtain an estimate of the total energy, the sky background around the source must not add to the total flux (i.e. the sum of the pixels in the sky annulus must be close to zero). Many FORCAST image have gradients in the background such that the sky annulus does not sum to zero, resulting in a curve of growth that does not asymptotically approach a constant value. To correct for this, the median sky background in the annulus is adjusted such that the curve of growth is flat at the source aperture boundary. A linear interpolation of the curve of growth is then used to find the radius corresponding to half the total flux at the aperture boundary.
For some calibration observations, the target is not a point source. FORCAST and HAWC+ frequently use planets or asteroids as a calibration source because they are bright in the mid-infrared, whereas there are few similar stellar sources. In the case of a nonpoint source, the angular diameter of the source at the time and location of the observation is determined by using JPL’s HORIZONS web interface (Giorgini, 2015). The angular diameter is subtracted out in quadrature, but in most cases, it is a small fraction of the total image size.
This procedure is followed to determine the 50% encircled energy diameter for FORCAST and FLITECAM flux calibration observation. There are also some preliminary data from HAWC+ using an early release pipeline. It is expected that the HAWC+ image quality will improve as the processing pipeline improves.
The resultant image size values are plotted in Fig. 11. SOFIA is effectively diffraction limited above 50μm. Between 2μm and 5μm, there is an interesting behavior. Models of the predicted seeing at these wavelengths show that the shear-layer seeing is the dominant contributor to the total image size. The models predict that at the shorter wavelengths measured by FLITECAM, the image size should be larger than those measured at the longer FORCAST wavelengths. However, the observed FORCAST image size between 5μm and 10μm is comparable to FLITECAM. This hints that there is something particular to FORCAST that might be degrading the image size at short wavelengths. The cause for this anomaly has not been identified, but it is plausible that intrinsic image size of the SOFIA telescope between 5μm and 10μm is better than what is measured with FORCAST.
The SOFIA program has stated that the goal is to have a 50% encircled image diameter of 1.8arcs averaged between 5μm and 10μm. The current value is 3.8arcs with the caveats discussed above. For longer wavelengths, it is a goal to achieve diffraction limited images at all wavelengths greater than 20μm, while the current measurement is diffraction limited beyond 45μm. To achieve these goals, the program has dedicated resources to further reduce vibrations of the telescope that contribute to increase image size.
Image ellipticity is calculated as a byproduct of the image size, and is defined as 1−(b∕a), where a and b are the semi-major and semi-minor axes, respectively. A 2-D rotated Moffat function is fit to each source in the image size determination. A Moffat function is used instead of a Gaussian because the wings of SOFIA’s PSF are wider and better modeled by a Moffat. The ellipticity is then calculated from the ratio of the full width at half max of each axis. Ellipticity is currently only measured with FORCAST data, as there is a known instrumental-induced elongation in the cross-elevation direction in FLITECAM images. Out of 2104 FORCAST ellipticity measurements, the median is 0.078 and the 68th-percentile, representing the 1-sigma confidence level is 0.14. The internal SOFIA requirement for ellipticity is less than 0.2, and the data show this is achieved with roughly 80% confidence. Table 4 presents a summary of the SOFIA Pointing Performance and Image Quality.
| Property | Mode | Value |
|---|---|---|
| Image size | 5μm<λ<15μm avg. | 3.80′′ |
| λ=6.35μm | 3.75′′ | |
| λ=7.71μm | 3.86′′ | |
| λ=11.09μm | 3.75′′ | |
| λ=19.71μm | 3.66′′ | |
| λ=25.25μm | 3.91′′ | |
| λ=31.46μm | 4.05′′ | |
| λ=33.50μm | 4.27′′ | |
| λ=34.81μm | 4.39′′ | |
| λ=37.14μm | 4.57′′ | |
| Image ellipticity | 5μm<λ<40μm | 0.078±0.06 |
| Pointing accuracy | On-axis tracking | 0.25′′+0.32−0.10 |
| Off-axis tracking | 0.41′′+0.48−0.20 | |
| Pointing drift | Focal Plane Imager, Sidereal | 0.06′′h−1 |
| Focal Plane Imager, Non-sidereal | 0.19′′h−1 | |
| Science Instruments | 0.38′′h−1 | |
| Pointing stability | All observing modes | 0.17′′ rms |
4.5. Atmospheric absorption and emission
At infrared wavelengths, molecules in the Earths atmosphere (CO, H20, etc.) absorb at select frequencies. Celestial radiation is typically attenuated by this absorption. In turn, the atmosphere also has emissivity at infrared wavelengths where the absorption is strongest. Whereas the absorption by the atmosphere is a straight line-of-sight integration over a path length through the atmosphere, the integrated emission is actually weighted by the temperature distribution through various layers of the atmosphere. It is therefore assumed that the atmospheric thermal emission is at a temperature somewhat less than the base temperature where the astronomical observations are actually taking place. A proper calculation of atmospheric emission would take this temperature weighted average into account.
Figure 12 (top) shows the atmospheric transmission from the ATRAN modeling program for a select wavelength range at an altitude of 41,000 feet for an astronomical target at an elevation angle of 45∘ (Casey, 2010). Although the atmosphere appears mostly transparent over this wavelength range (transmission ∼99%), dips in transmission do occur at select wavelengths. Over the wavelengths in Fig. 12 (top), the average transmission is 86.8% or an absorption efficiency of 13.2%. Atmospheric transmission varies with wavelength with a relative increase between 30microns and 300microns. The bottom in Fig. 12 shows the sky+telescope background for SOFIA at 41K feet and elevation angle of 45∘ at near infrared wavelengths.
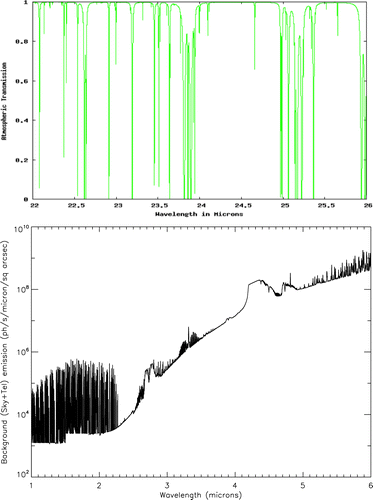
Fig. 12. Top: The atmospheric transmission from ATRAN for 22–26microns at 41,000 feet with an overhead water vapor burden of 7.3 microns for an object at 45∘ of elevation. Bottom: Theoretical calculation of the sky+telescope background in photons × (s μm arcsec2)–1 for SOFIA at 41,000 feet and elevation angle of 45∘. A sky temp=240K and the same value for the telescope temperature was assumed.
4.6. Observatory effective emissivity
Effective emissivity in this context includes emissivity as well as light scatter and diffraction by the mirrors, support struts, barrel, cavity and aft ramp, Nasmyth tube and tertiary mirror pedestal. Note that the combined effects of contamination on the mirror surfaces (soot, dust, oils, etc.) plus the degradation (oxidation) of the mirror coatings together produce the observed emissivity.
Telescope Optics: To date, the current configuration of the SOFIA telescope employs a dichroic tertiary mirror which reflects infrared light longward of 1 micron down the Nasmyth tube. This is called the infrared beam, and is sent directly to the science instrument. Wavelengths shorter than 1 micron are passed through the dichroic to a folding aluminized mirror down the Nasmyth tube for use by the focal plane imager as a star tracker. This is the visible beam. Figure 13 shows reflectance measurements of the dichroic mirror at optical and near-IR wavelengths. The wavelength cut-off at about 1 micron is evident.
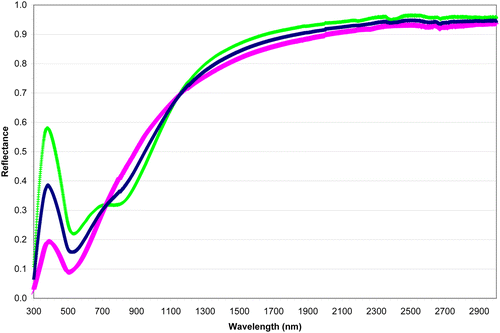
Fig. 13. Reflectance measurements of the dichroic tertiary mirror at optical and near-IR wavelengths. The incidence angle for the measurements was 45∘. Both polarizations (green and purple lines) and the averages (dark blue line) are plotted.
The SOFIA program is currently evaluating the science needs for a fully reflective (aluminized) tertiary which will allow all light to pass directly to the science instrument. This, in effect, removes the focal plane imager from the tertiary beam, rendering it useless. Star tracking is then done by one of the imagers on the telescope head ring, either the fine- or wide-field imagers.
The primary and secondary mirrors are coated with aluminum for broadband high-reflectivity. The tertiary dichroic is coated with gold and protected by a layer of aluminum oxide (Al2O3). While gold is highly reflective, like aluminum, the differences between the two metal coatings occur mostly in the visible spectrum. Laboratory measurements of the SOFIA tertiary mirror show that this optical element has a strong absorption feature at 12 microns which (in turn) increases the emissivity of the tertiary. Although the reflectivity of the telescope optics is high (∼98%), the residual absorptivity of the optics contributes to the overall infrared background. The reflectivity of both aluminum and gold are given in Fig. 14 for the region between 2 and 20 microns. Aluminum is highly reflective across this region as is gold. However, the addition of the aluminum oxide protective coating over the dicroic tertiary leads to a strong absorption feature at 12 microns. While not crippling for observations, it is indeed significant for those who sample their data within this 12 micron band.
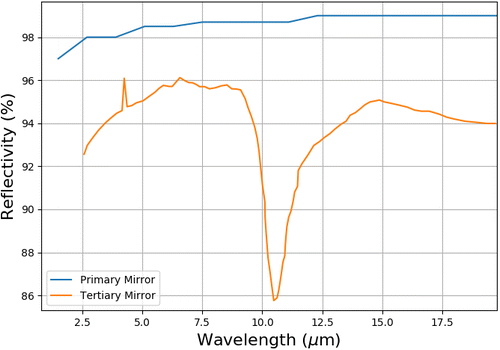
Fig. 14. Laboratory reflectivity measurement of the SOFIA dichroic tertiary mirror (orange line) in the near- mid-IR. Note the deep decrease in reflectivity in the 8–14 micron window. The blue line shows the same parameter for the alluminized Primary Mirror.
Particulate Matter: A secondary contribution to the telescope emissivity is the effect of small particle contaminants which can scatter light from within the aircraft cavity into the field of view of the telescope. Studies from the KAO indicate that these contaminants are often associated with paint and dirt from the aircraft fuselage itself and are not the result of airborne particles at altitude of 35,000 ft and above. The proportional contribution of the particulate contaminants to the infrared background has been modeled using the scattered light software of APART (from Breault Research Organization, Tuscon, AZ) and represent a wavelength depended contribution to the infrared background in addition to what is expected for emissive telescope optics. The modeling of particulates upon the SOFIA telescope optical surfaces increases the thermal emission of each surface as a function of wavelength from 5–100microns. In general, the emission of particulate matter, slightly decreases with wavelength, and contributes an incremental emissivity of <2%.
Blackened Structures within the Fiels of View: A final element of the overall telescope emissivity is the contribution of blackened views of the telescope structure itself with the field of view. As seen within the primary mirror (via the tertiary and secondary mirror), the secondary mirror support structure, the three secondary mirror support legs and a portion of the telescope head ring is apparent. Within the secondary mirror, one sees the beveled edge and mounting holes of the secondary mirror button.
Changes in Mirrors Emissivity: The degradation in mirror reflectivity can occur with changes in the aluminum coating as a result of pitting or a reduced coating thickness. Pitting of the aluminum surface can occur when water combines with particulate matter and forms a mildly acidic compound that physically etches away aluminum over coat. Since both the primary and secondary mirror surfaces are aluminized, the freshly coated reflectivities are approximately the same at infrared wavelengths (i.e. 98%). The tertiary mirror reflectivity varies considerably over a wavelength range of 10 to 100 microns. This is directly a result of the proprietary dichroic coating of the tertiary mirror that reflects infrared while transmitting in the optical. Cleaning the mirror to keep it free of dust, and re-coating the mirror as the coatings are degraded, will keep the telescope’s emissivity below some threshold value.
In order to decide whether and when to clean or recoat the primary mirror, reflectivity measurements are periodically performed. Figure 15 shows Primary Mirror reflectivity measurements in the mid-infrared for use in determining effectiveness of mirror cleaning and trends in reflectivity versus time. Starting with measurements of the freshly coated mirror in 2009, the general trend indicates an approximate 2% degradation in reflectivity in the past nine years. It is worth noting that the frequent water wash and snow cleanings are very effective in removing dust and particulate matters from mirror surfaces as is evident from the reflectivity measurements subsequent to each cleaning process.
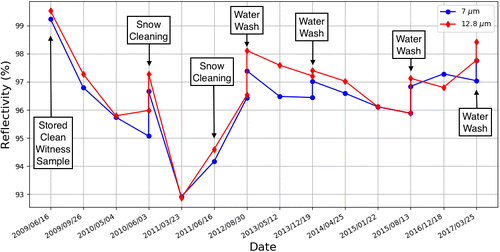
Fig. 15. Compiled Primary Mirror reflectivity measurements for use in determining effectiveness of mirror cleaning and trends in reflectivity versus time.
4.6.1. Emissivity measurements
Emissivity measurements have been performed in two occasions in the past using the FORCAST and FLITECAM Instruments (Reach et al., 2014). The measurements performed by the FORCAST team involve pupil images wherein the thermal emission from the mirror is imaged together with the secondary support structure. Details of FORCAST emissivity measurements are reported in the FORCAST dedicated paper included in this SOFIA Special Issue (Herter et al., 2018); here, we present the results for completeness. The infrared emissivity of the primary–secondary combination can be estimated using both a pupil image and a slightly misaligned pupil image that allows to look past the secondary mirror showing both sky and a direct view of one of the support struts.
Primary–secondary mirror emissivity ϵps is evaluated by
where (i) Sblk is the brightness looking at a support structure. This light path contains emission from the support structure, tertiary, window, and all warm elements within the instrument, (ii) Soff is the brightness looking past the secondary, essentially through the hole in the primary mirror (Fig. 16) and into the atmosphere and space. This light path contains emission from the sky, tertiary, window, instrument, (iii) Son is the sky brightness looking at the secondary, this includes light from the sky, primary and secondary mirrors, tertiary, window and instrument. Rps=(1−ϵps) is reflectivity of the primary–secondary mirror combination, and B(T) is the Plank function.
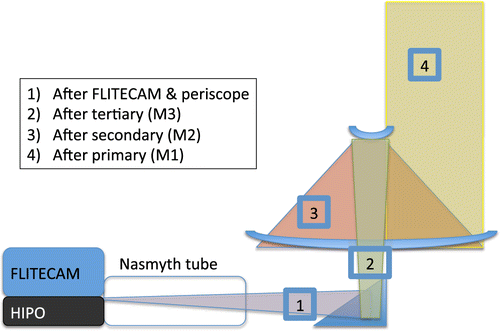
Fig. 16. Schematic diagram illustrating the four light paths for emissivity measurements using the FLITECAM Instrument. The cold load were place in front of each mirror as shown in the figure and exposures taken with FLITECAM. (Note that the location of the tertiary is shown behind the primary mirror in this schematic for clarity, whereas it is in fact in front of the primary.
The use of brightness ratios effectively removes many practical factors and allows measurement of system properties directly. The dimensionless function f depends very sensitively on the temperatures Tps,Ttel,Tatm. It is extremely sensitive to the difference in temperature between the primary mirror and the telescope support structure that is measured in Sblk. FORCAST measurements at 11.3μm provide a 7% emissivity for the primary-secondary mirror combination. Estimated uncertainty is of the order of 40% due to the possible temperature difference between the structures, though repeatability of the experiment suggests relative uncertainties are as small as 10–20%. It is worth noting that the pupil imaging method does not enable us to determine the total emissivity of the telescope (ϵtel=ϵter+ϵps), as it does not isolate the emissivity from the tertiary mirror (ϵter) or the contribution of the instrument + window.
FLITECAM measurements were performed on the ground in 2011, and included cold loads (LN2 cooled) placed in the optical path (Fig. 16). The telescope was pointed to 0 degrees elevation and a cold load was placed in front of the secondary or tertiary mirrors at several different positions. Measurements were taken in the 3.08μm narrow band filter of FLITECAM, in its subarray mode (with 50ms readouts), at each cold load position, with the telescope cavity door closed (Smith, 2012).
Since we are interested in the total telescope emissivity, we must isolate the contribution from the instrument, the entrance window and periscope(e). For this reason an initial emissivity measurement for FLITECAM and HIPO was performed on the Telescope Alignment and Assembly Simulator. These measurements allow an estimate of the number of FLITECAM counts as a function of emissivity. The FLITECAM window emissivity was measured at 9% and the HIPO periscope emissivity at 13%. With the measured brightness at each of the four locations Si=ϵiB(Ti), we can derive the emissivity of each element in the optical path and the total telescope emissivity ϵtel.
The emissivities of the components can be derived from the brightness differences
The brightness right at the FLIPO in absolute terms is S1=SFLIPO=ϵFLIPOB(TFLIPO). If we assume all of the components are at the same temperature, i.e. Ti=T, then B(T)=S1∕ϵFLIPO.
Combining the brightness differences, we derive the total emissivity of the telescope including primary, secondary, and tertiary
The FORCAST result for the primary–secondary mirror yields 7% at a wavelength of 11.3μm, while the emissivity at 3.1μm of the combined mirrors is 11.9%. Part of the discrepancy can be attributed to the changes with wavelength of the emissivity of aluminum foil. Measurements on an aluminum mirror (Bartl & Baranek, 2004) show that the trend of lower emissivity in the mid-infrared versus visible and near-infrared is in the same general direction as seen on SOFIA.
4.7. Telescope induced polarization
The Science Instrument HAWC+ is designed to allow total and polarized flux imaging in five far-IR broad bands (Vaillancourt et al., 2007; Harper et al., 2018). The HAWC+ Instrument, as well as any potential future polarimeter instruments on SOFIA impose limits on the acceptable intrinsic polarization of the SOFIA telescope assembly. In order to allow reliable measurements of polarization of astrophysical sources, systematic errors should be minimized. Sources of systematic measurements’ uncertainties are related to unknown polarization of the reference beam flux and to the telescope induced polarization changes that may arise during the chop-nod sequence of polarimetric observations.
Instrumental induced polarization arises from differential loss through a non-isotropic material or reflection off a surface at non-normal incidence (Born & Wolf, 1980; Breckinridge & Oppenheimer, 2004). The instrumental polarization, which combines the contribution of both the Science Instrument and the telescope assembly, is removed from the total measured polarization via Normalized Stokes parameters q=Q∕I,u=U∕I (van de Hulst, 1957) as
Table 5 shows the Instrumental Polarization determined with October–November 2017 polarization skydips, and with corrections for polarization efficiency and absolute angle calibration.
| HAWC+ Band central wavelength (μm) | Degree of polarization (%) | Angle in SIRFa coordinates (∘) |
|---|---|---|
| 53 | 2.13 | −9 |
| 89 | 2.07 | −3 |
| 155 | 2.02 | −6 |
| 216 | 1.85 | 3 |
The most likely sources of the instrumental polarization are the SOFIA dichroic tertiary mirror and the HAWC+ high-density polyethylene vacuum window. Since the instrumental polarization observed in flight is about a factor of 2 higher than measured in the lab for the instrument alone, the tertiary mirror seems to be a significant contributor, if not dominant. In fact, the direction of polarization (Table 5) is for all bands within 9∘ of that expected for reflection off the tertiary. Since the SOFIA telescope induced polarization is required to be less than 4%, Table 5 indicates that the requirement is met with ample margin.
5. Summary
SOFIA has reached full operational capability in February 2014 and since then over 350 science flights have been completed providing an excess 2900h of science data collection. In this paper, we have presented some observatory performance and capabilities that are directly linked to high-level science requirements. Being an all-purpose general observatory, covering a range in wavelengths that extend from optical to sub-mm, SOFIA needs to have broad capabilities that can be applied to a large range of science projects. The observatory technical performance are well in line with the designed requirements. Telescope pointing and tracking have reached a level of excellent performance considering the challenges intrisically posed by airborne observations. Certain areas, such as image stabilization which has an impact on the image size at short wavelengths (∼1–30μm), are being iteratively improved through the application of several passive and active technologies, such as mechanical dampers, upgraded and more sensitive guide cameras.
With the recent successes of aligning SOFIA technical performance to science requirements, and with the anticipation of future instrumentation, the observatory is able and ready to serve the scientific community for a wide range of unique observations.
Acknowledgments
We thank Dr. E. Dunham, PI of the HIPO Instrument, for his involvement and substantial contribution to the many aspects of the observatory commissioning and characterization.
Notes
c First Light Infrared TEst CAMera (McLean et al., 2006).
d High Speed Imaging Photometer for Occultations (Dunham et al., 2004).
e Since FLITECAM was co-mounted with HIPO at the time of the measurements (FLIPO configuration), the HIPO periscope was a significant source of emissivity in the optical path.

