Two-photon excitation fluorescence lifetime imaging microscopy: A promising diagnostic tool for digestive tract tumors
Abstract
Digestive tract tumors account for 15% and 19.3% of the cancer incidence and deaths, respectively. Early detection of digestive tract tumors is crucial to the reduction of global cancer burden. Two-photon excitation fluorescence lifetime imaging microscopy (TP-FLIM) allows non-invasive, label-free, three-dimensional, high-resolution imaging of living tissues with not only histological but also biochemical characterization ability in both qualitative and quantitative way. Benefiting from these advantages, this technology is promising for clinical diagnosis of digestive tract tumors. In recent years, many efforts have been made in this field and some remarkable progress has been achieved. In this paper, we overview the recent progress of TP-FLIM-based researches on digestive tract tumor detection. Among them, our latest results on the gastric cancer and esophageal cancer are elaborately depicted. Finally, we outlook and discuss the potential advantages and challenges of TP-FLIM in future clinical applications.
1. Introduction
The colorectal cancer, gastric cancer, and esophageal cancer account for three of the top 10 cancers worldwide and three of the top 5 cancers in China, respectively, in terms of the morbidity and mortality.1,2 The early diagnosis and treatment of digestive tract tumors is of great significance.
The routine clinical diagnosis method for digestive tract tumors is adopting the gastroscopy or colonoscopy for primary visual inspection, followed by biopsy and subsequent histopathological examination. This process is regarded as the gold standard for clinical diagnosis. However, this method is invasive and impractical for screening high-risk patients who may have multiple suspicious lesion sites. To reduce ambiguous or negative results caused by insufficient sampling, repeated endoscopy and biopsy must be performed sometimes, which unavoidably leads to bleeding and crush artifacts. Furthermore, for histopathological examination, the routine preparation procedure is extraordinarily time-consuming, usually needs 3–5 days, and the diagnosis strongly depends on the quality of sample preparation and the personal experience of pathologists.3,4 Thus, a technology that allows real-time histological diagnosis of digestive tract tumors during routine endoscopy is extremely desired.
Optical microscopy has long been considered as an important tool for biomedical research due to its high-resolution, non-invasive, no-damage, and rapid imaging ability. Each step of advancement in optical microscopy has greatly promoted the development of life sciences, preclinical medicine, and clinical diagnostics. Since the 20th century, the field of optical microscopy has made rapid progress. Many novel technologies and tools have emerged, such as confocal microscopy, two-photon microscopy (TPM), light-sheet microscopy, and super-resolution microscopy. Among these techniques, TPM is considered as one of the most landmark inventions. It is expected to be a powerful tool for digestive tract tumor detection.
TPM was first realized by Watt W. Webb and co-workers in 1990.5 The near-infrared excitation light and the localized nonlinear signal generation of TPM result in low photobleaching and phototoxicity, superior tissue penetration, sub-cellular resolution, and intrinsic axial sectioning. Moreover, this technology has the ability of utilizing endogenous fluorophores to realize label-free imaging.6,7,8 Due to these advantages, TPM is considered to be one of the microscopies that are most suitable for intravital imaging.7 Since its invention, TPM has gradually become a powerful tool for studying the occurrence, development, and potential treatment strategy of diseases, such as various cancers and Alzheimer’s disease.6 Furthermore, the feature of noninvasive, label-free imaging ability, as well as the superior imaging depth and resolution, allows TPM to be one of the most potential clinical research tools. Currently, this technology has been successfully used in clinical researches of tumor development, drug release control, and intravital drug screening.9
Fluorescence lifetime characters the time that a fluorophore stays in its excited state. The fluorescence lifetime characteristic is measured by detecting the dynamic process of fluorescence intensity decay using time-resolved technology.10 Exploiting the time-resolved fluorescence detection technology to study biological systems has many unique advantages. First, similar to the fluorescence spectrum, fluorescence lifetime is another fingerprint feature of a fluorophore. It provides an additional dimension of information for fluorescence imaging10,11,12 and can be exploited for separating biomolecules with largely overlapped spectra but different fluorescence decay speeds.10,13 Secondly, the transition of fluorophore from the excited state to the ground state is sensitive to its local environment, such as the pH, temperature, oxygen concentration, ion concentration, enzyme activity, and molecular configuration.10,12,14,15 For instance, the fluorescence lifetime of reduced nicotinamide adenine dinucleotide (NADH) changes from hundreds of picoseconds to a few nanoseconds when it was bound to proteins.16 Thus, the fluorescence lifetime detection technology can be used to monitor the parameters of tissue microenvironment and study the interactions between proteins.10,14 Thirdly, fluorescence lifetime is usually independent of the concentration and quantum yield of the fluorophores.10,12,14,15 Since the content of fluorophores in living tissues is difficult to assess and may vary with time, the fluorescence lifetime detection technology can provide more accurate in vivo measurement relative to steady-state technologies such as fluorescence spectrum detection.10,14 Based on these advantages, fluorescence lifetime imaging microscopy (FLIM) has attracted lots of attention and has been widely used in biophysics and medical diagnosis researches.13
With complementary advantages, the combination of TPM and FLIM creates a win-win situation. On the one hand, TPM technology provides the pulse laser excitation source which is required for fluorescence lifetime detection. Additionally, benefiting from the intrinsic axial sectioning ability of TPM, the crosstalk between signals from different depths during fluorescence lifetime measurement of thick tissues can be avoided.14 On the other hand, by introducing fluorescence lifetime detection, the TPM allows multidimensional characterizing of fluorescence signal. As a result, both its functions and applications are expanded, providing a powerful approach for detailed morphological and biochemical characterization of tissues.12 In recent years, due to the development of new instruments and data analysis methods, many researches on biomedical and clinical applications of TP-FLIM have been actively carried out and lots of progress has been achieved.12,17,18,19,20,21,22,23
This paper first provides a brief overview of the concept and common detection methods of two-photon fluorescence lifetime and then combines the latest research results of our group to summarize the research progress made in the field of TP-FLIM-based digestive tract tumor detection. Additionally, we make a brief prospect on the future of TP-FLIM in clinical applications from aspects of possible challenges and potential advantages.
2. Basic Principles, Detection Methods, and Instrumentations of TP-FLIM
2.1. Basic principles of two-photon excitation fluorescence lifetime
TPM is based on two-photon excitation which is a nonlinear optical process. In brief, a fluorophore first simultaneously (with ∼0.5fs) absorbs two excitation photons that combine their energies to promote the fluorophore to an excited state and then proceeds along various emission or nonemission pathways to return to the ground state. One of the pathways is the spontaneous emission, by which the molecule emits a photon, namely, two-photon excitation fluorescence.6 Conceptually, fluorescence lifetime is the average time that a fluorophore stays in its excited state.10 Physically, it is defined as the time that the fluorescence intensity decays to 1/e of its maximum.12,15,24 For a given fluorophore, this process can be described as follows :
There are abundant endogenous fluorophores in biological systems, such as NADH, oxidized flavin adenine dinucleotide (FAD), melanin, and tryptophan, whereas biomedical studies always require introducing exogenous fluorescent markers into cells or tissues. Therefore, the fluorescence decay process in biological samples generally resembles a multiexponential decay :
2.2. Detection methods for two-photon excitation fluorescence lifetime
At present, a series of detection techniques have been developed for fluorescence lifetime measurement. From the aspect of signal processing, these techniques can be divided into two categories, which are the frequency-domain method and the time-domain detection method.10,14,24
2.2.1. Frequency-domain detection technique
The frequency-domain detection technique uses a modulated excitation light to excite the sample. The fluorescence lifetime is calculated by measuring the phase shift and modulation degree of the fluorescence signal relative to the modulated excitation light at one or more modulation frequencies. The fluorescence signal of the sample has the same frequency as the modulated excitation light but a delayed phase and a degraded modulation degree. The change in phase and modulation degree all depends on the fluorescence lifetime τ and the modulation frequency ω :
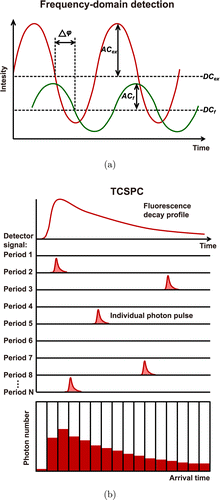
Fig. 1. The principles of common fluorescence lifetime detection methods: (a) frequency-domain detection technique and (b) time-correlated single photon counting (TCSPC) technique.
Particularly, the frequency-domain technique can adapt to a wide range of fluorescence intensity variations and tolerate extremely high fluorescence intensity, but in the case of weak fluorescence, the detection efficiency will drop sharply. This involves complex electronic design principles and related applications. For details, refer to Ref. 14.
2.2.2. Time-domain detection technique
The time-domain techniques directly record the fluorescence intensity as a function of time, namely, the fluorescence decay curve, after the fluorescent molecules being excited by an ultrashort pulsed light. The fluorescence lifetime is usually calculated by fitting the decay curve using a single- or multi-exponential function. From the perspective of electronics, the methods for recording fluorescence decay curve can be divided into two categories: analog techniques and digital (photon counting) techniques.14 The analog techniques consider the fluorescence signal as a continuous wave, sequentially shifting a narrow time gate on the signal wave and recording the amplitude of the signal within the time gate to form a fluorescence decay curve.14,25 In contrast, the photon-counting techniques regard the fluorescence signal as a random sequence of single photon pulses. By counting the number of photon pulses arriving at a series of time channels, a histogram of the time intervals between the fluorescence photons and the excitation laser pulses could be recorded. This histogram reflects the fluorescence intensity decay. Therefore, the photon-counting techniques record the density of photon pulses rather than their amplitude to detect the fluorescence intensity in time domain.14,25
The photon-counting techniques have several advantages over the analog techniques. First, the random amplification process of the detector would cause significant jitter in the amplitude of the individual photon pulse, which is referred to as gain noise, and there is also electronic noise in the measurement system. Using analog recording techniques, both gain noise and electronic noise are superimposed on the measurement results. The photon-counting techniques only concern the number of photon pulses. The amplitude of the electronic noise is always smaller than that of the photon pulse. Therefore, neither the gain noise nor the electronic noise can interfere with the accuracy of the photon-counting techniques, resulting in a significantly improved signal-to-noise ratio relative to the analog techniques. Secondly, the photon-counting techniques can accurately record the arrival time of each photon pulse. Their temporal resolution is only limited by the transit time spread of the photon pulses in the detector, which is usually an order of magnitude narrower than the pulse width. Therefore, using the same detector, the photon-counting techniques present higher temporal resolution than that of the analog recording techniques. The above advantages of the photon-counting techniques make it highly suitable for the detection of fluorophores with short lifetime and weak signal.14,25
Time-correlated single photon counting (TCSPC) is a representative photon-counting technique. It is suitable for detecting fluorescence signal with low intensity and high repetition rate, such as two-photon excitation fluorescence of biological tissues. By recording the time that a single photon pulse arrives in the signal period and accumulating the number of photon pulses arriving at each time point, a histogram of photon number distribution over time can be established. Thereby, a fluorescence decay curve is obtained for fluorescence lifetime calculation (Fig. 1(b)). TCSPC technique is capable of recording fluorescent signals with extremely high temporal resolution and efficiency. It is particularly suitable for resolving tissue autofluorescence components which have the characteristic of extremely short fluorescence lifetime. With the rapid development of electronic technology, TCSPC technique achieves breakthrough progress and enters into the advanced TCSPC stage. The advanced TCSPC device integrates all necessary modules onto a single board and records the fluorescence signal using multidimensional detection methods. This technology can record photon density variation with not only arrival time in the signal period, but also wavelength, spatial coordinates, imaging time, and so on. The high temporal resolution, precision, sensitivity, efficiency, as well as the multi-dimensional detection ability of advanced TCSPC make it a widely used tool for biomedical researches.10,14,24,25
2.3. Instrumentations of the TP-FLIM
Typical TP-FLIM imaging system is shown in Fig. 2. For both frequency-domain and time-domain fluorescence lifetime detection setup, a femtosecond pulse laser is always used as the excitation source.14 A pair of rotatable mirrors is used to raster scan the excitation light on the sample plane to form a two-dimensional image. Specifically, the excitation light reflected by the scanners passes through the dichroic mirror and focussed onto the specimen by an objective. The two-photon excitation epifluorescence generated from samples is collected by the same objective and then separated from the excitation light by the dichroic mirror. Afterwards, the fluorescence signal is captured by a detector and then input into a fluorescence lifetime detection module for further processing. In terms of frequency-domain detection, the module measures the phase and modulation degree of the fluorescence signal relative to the excitation light, whereas for time-domain detection, the module records the fluorescence decay curves.14 By processing and analyzing the measured data, the system will output the fluorescence lifetime information and corresponding images of the specimen.
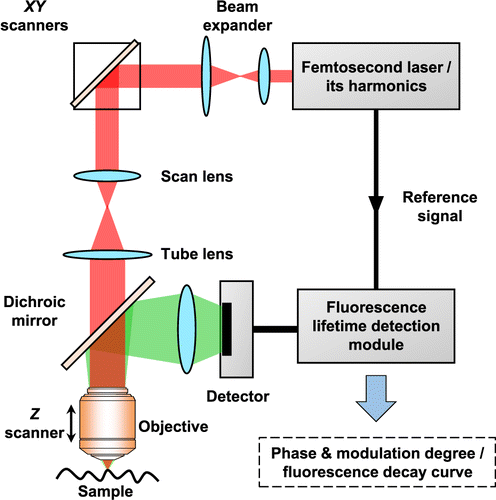
Fig. 2. Schematic diagram of typical two-photon excitation fluorescence lifetime imaging system.
3. The Bases of Tumor Diagnosis Using TP-FLIM
A remarkable advantage of TP-FLIM is that it has the ability to detect the metabolic state of cells and tissues by measuring their autofluorescence signals.25 This unique property provides the bases of using this technology for tumor diagnosis.
Specifically, the energy of cells is mainly derived from glycometabolism. Normal cells execute oxidative phosphorylation and anaerobic glycolysis under well-oxygenated and hypoxic conditions, respectively. In contrast, tumor cells preferentially use anaerobic glycolysis pathway for obtaining energy even under the condition of sufficient oxygen. This phenomenon is referred to as Warburg effect.26 NADH and FAD, which serve as the principal electron donor and acceptor in the cellular metabolic process, respectively,27 are the main intracellular endogenous fluorophores.8 It is well known that the ratio of free and protein-bound NADH as well as the ratio of NADH and FAD could be considered as the indicators of cell metabolic state.28,29 The difference in metabolic pathway between normal and tumor cells or tissues could be inspected by measuring the fluorescence characteristics of NADH, FAD, and other endogenous optical biomarkers.30,31 The state variation of these fluorophores, such as bounding to protein, associating to cell membrane or lipids, may lead to the change of their fluorescence quantum yields8 or fluorescence decay speeds.16,32 Therefore, TP-FLIM of endogenous fluorophores could be used to detect the metabolic state of cells and tissues.
Besides, cytochrome oxidative phosphorylation is regulated by heme. Tumor cells prefer to execute anaerobic glycolysis rather than cytochrome oxidative phosphorylation pathway for energy generation, resulting in decreased demand of heme and the accumulation of heme’s precursor, protoporphyrin IX (PpIX). PpIX is another endogenous optical biomarker, which can emit red fluorescence. But, the content of PpIX in tumor tissue is usually too low, resulting in a weak fluorescence intensity. In practice, exogenous aminolevulinic acid (ALA), which is PpIX’s precursor, is commonly introduced to promote the accumulation of PpIX so that the contrast between normal and tumor tissues could be enhanced in imaging.33
Therefore, depending on intrinsic fluorophores, such as NADH, FAD, and PpIX, TP-FLIM is capable of revealing the metabolic differences between normal and tumor cells, and thus has the potential to provide cellular-level tumor diagnosis. Currently, TP-FLIM imaging of NADH, FAD, and PpIX has already been used for the detection of premalignant and malignant lesions at the level of cultured cells, animal models, and human biopsy tissues.19,20,34,35,36,37
4. Applications of TP-FLIM in Digestive Tract Tumor Diagnosis
The digestive tract is an important part of the digestive system. It starts from the mouth and ends with the anus, composing of oral cavity, esophagus, stomach, small intestine (duodenum, jejunum, and ileum) and large intestine (cecum, colon, rectum, and anal canal).38 Currently, TP-FLIM has already been applied to the detection of digestive tract tumors, such as oral cancer and colorectal cancer, and significant progress has been made in this field.
4.1. Oral cancer
Based on free and bound NADH, Angelika Rück et al. compared nonmalignant human oral mucosa cells with different human oral squamous carcinoma cells from the aspect of energy metabolism. The results indicate that the malignant oral mucosa cells have longer mean fluorescence lifetime as well as reduced NADH content and free/bound NADH ratio relative to nonmalignant cells. Notably, the most aggressive cells were found to show the longest lifetime.39 Skala et al. investigated the metabolism of normal and precancerous or cancerous oral squamous epithelia mucosa by detecting the fluorescence of NADH and FAD. By adopting a dimethylbenz(a)anthracene (DMBA)-treated hamster cheek pouch model of oral squamous epithelial precancer for in vivo TP-FLIM imaging, they demonstrated that the TP-FLIM has the ability to distinguish precancerous oral lesions at very early stage (Fig. 3).20,40,41
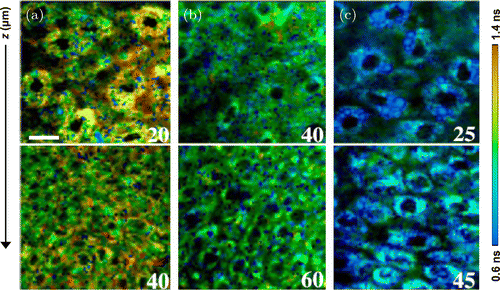
Fig. 3. Two-photon excitation fluorescence lifetime imaging of the hamster cheek pouch model of oral cancer in vivo. NADH lifetime-coded images of tissues diagnosed as (a) normal, (b) low-grade precancer, and (c) high-grade precancer. The numbers labeled on the corner of each image indicate the depth below the tissue surface in μm. Scale bar, 20μm.20 (Adapted with permission from Figs. 1(d), 1(e), and 1(f) in Ref. 20. Copyright (2007) National Academy of Sciences.)
In addition to NADH and FAD, researches based on other intrinsic optical biomarkers are also being actively carried out. For instance, Yu-Fang Shen et al. utilized signals from the endogenous bilirubins to perform oral cancer detection research at the cultured cell level. They found that, comparing with normal oral keratinocytes (250ps), oral cancer cells (>330ps) have longer fluorescence lifetime.42 We explored the ability of TP-FLIM for intravital noninvasive detection of squamous epithelial precancer at the level of animal model. By imaging the endogenous keratin, collagen, tryptophan, and so on, we derived more than 10 indicators for the diagnosis of precancers and cancers of oral epithelium (Fig. 4). These indicators contain not only the morphological and structural information (the 3D distribution of fluorescence intensity and spectra) but also the biochemical properties (the fluorescence lifetime and other related parameters) of tissues.41
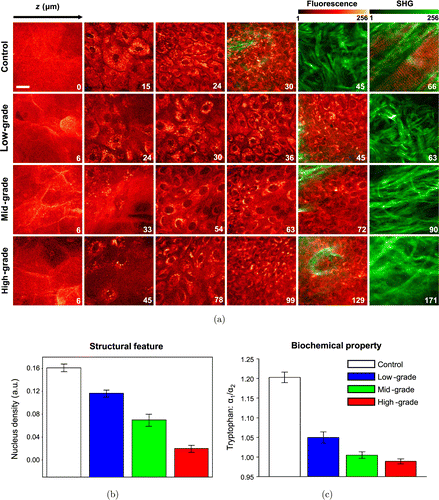
Fig. 4. In vivo two-photon excitation fluorescence lifetime imaging of hamster cheek model of oral squamous epithelial precancer during precancerous tissue transformation process. (a) Representative images created by merging two-photon excitation autofluorescence signals and second harmonic generation signals. The excitation wavelength is 745nm. The depth is labeled in μm on the bottom left corner of each panel. Scale bar, 20μm. (b) Representative structural-feature and (c) biochemical-property parameters that can be used to distinguish the different pathological stages.41 (Adapted with permission from Figs. 2, 3(c), and 5(c) in Ref. 41 with permission granted by SPIE.)
4.2. Colorectal cancer
TP-FLIM has also been used for colorectal cancer diagnosis. Pirmin H. Lakner et al. constructed 3D in vitro luminal models of colorectal carcinoma using human Caco-2 colorectal adenocarcinoma cells. By applying different agents to change the metabolic state of the 3D models in a positive or negative way and detecting NADH fluorescence signal, they demonstrated that TP-FLIM is a suitable technology for interpreting the shift in cellular metabolic activity (Fig. 5).43 This work provides new evidence to support the hypothesis that the TP-FLIM technology has the ability to characterize cellular metabolic state. Javier Adur et al. performed ex vivo TP-FLIM imaging on healthy and cancerous human colonic crypts based on NADH and FAD fluorescence signals. The analysis results illustrate that colonic adenocarcinoma cells show a longer mean fluorescence lifetime compared with the benign colonic mucosa (Fig. 6). In addition, the stroma collagen fibers were found to significantly change in content, distribution, and organization as colon cancer occurs.44 These results prove that TP-FLIM has the potential to become a diagnostic tool for colorectal tumor.
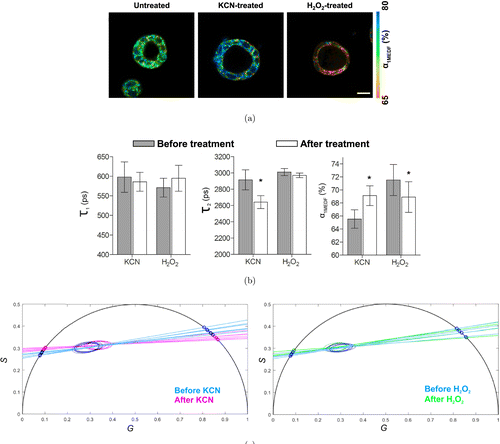
Fig. 5. Two-photon excitation fluorescence lifetime imaging of 3D Caco-2 luminal cysts which are untreated and treated with KCN or H2O2. (a, b) Fluorescence lifetime characteristic derived from multiexponential decay fitting (MEDF). α1MEDF is the short fluorescence lifetime contribution. τ1 and τ2 are the short and long fluorescence lifetime components of NADH, respectively. Scale bar, 200μm. (c) Fluorescence lifetime characteristics shown as phasor plots.43 (Adapted with permission from Figs. 1, 5(d), and 5(e) in Ref. 43 with permission granted by Scientific Reports.)
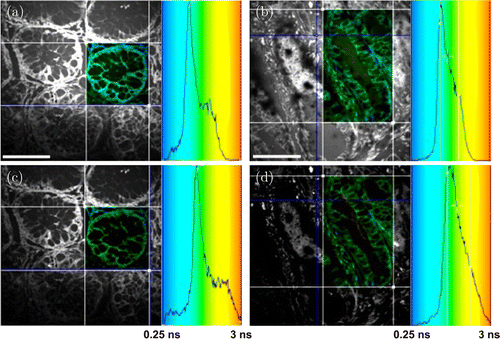
Fig. 6. Two-photon excitation fluorescence lifetime imaging of colon cancer. Ex vivo imaging of (a, c) healthy and (b, d) cancerous human colonic crypts based on NADH (a, b) and FAD (c, d) fluorescence signals. The ROIs are shown as fluorescence lifetime-coded images and corresponding lifetime histograms are presented on the right. Scale bar, 50μm.44 (Adapted from Fig. 5 in Ref. 44 with permission granted by SPIE.)
4.3. Gastric cancer
TPM has been used in investigations of gastrointestinal diseases.4,45,46,47,48 Despite the recognized inherent advantages over the conventional TPM, the full potential of TP-FLIM in gastric cancer detection has not been extensively evaluated.
In our previous study, we demonstrated the feasibility of using TP-FLIM to quantitatively differentiate the premalignant and malignant gastric tissues based on a home-build spectrum-resolved TP-FLIM imaging system.49 In this system, a TCSPC module (SPC-150, Becker & Hickl GmbH) was used to acquire fluorescence lifetime information, while a spectrograph and a linear-array photomultiplier tube with high-sensitivity and 16 detection channels (PML-16-C, Becker & Hickl GmbH) were combined to perform spectrum detection. Fresh human gastric antrum mucosa specimens at the typical stages of gastric carcinogenesis, including normal, chronic gastritis with erosion (CG-E), chronic gastritis with intestinal metaplasia (CG-IM), and intestinal-type adenocarcinoma (ITA), were imaged using this system (Fig. 7). An excitation wavelength of 750nm was particularly selected to induce the intrinsic two-photon excitation fluorescence signals that mainly originate from NADH and the second harmonic generation (SHG) signals that primarily come from collagen. The imaging results show that the sub-structures of healthy and diseased gastric mucosa, including surface epithelium, interstitial tissue of lamina propria and gastric pit as well as the multiple cell types, such as mucous epithelial cell, goblet cell, and so on, can be clearly identified according to the fluorescence lifetime and spectrum information. Moreover, by separately extracting the spectral and lifetime features of the sub-structures, multiple quantitative indicators which have the potential to discriminate the multiple stages of gastric carcinogenesis can be derived.
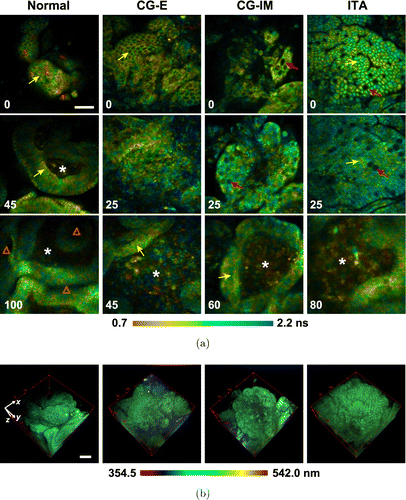
Fig. 7. Two-photon excitation fluorescence lifetime and spectral imaging of fresh human gastric antrum mucosa specimens at the typical stages of gastric carcinogenesis, including normal, chronic gastritis with erosion (CG-E), chronic gastritis with intestinal metaplasia (CG-IM), and intestinal-type adenocarcinoma (ITA). (a) Fluorescence lifetime-coded images. The depth is labeled in μm on the bottom left corner of each panel. (b) Fluorescence spectra-coded 3D images. Yellow and red arrows indicate the mucous epithelial cells and goblet cells, respectively. “*” and “Δ” indicate the interstitial tissues and gastric pits, respectively. Scale bars, 50μm.49 (Adapted with permission from Figs. 4 and 8 in Ref. 49. © The Optical Society.)
Recently, we also performed an investigation on different types of gastric cancers. By comparing the derived spectral and lifetime characteristics of ITA and neuroendocrine carcinoma (data not shown), we demonstrated the potential of TP-FLIM for sub-type classification of malignant gastric lesions.
These studies suggest that, merely depending on endogenous fluorophores, spectrum-resolved TP-FLIM is capable of revealing the 3D structural and biochemical features of fresh gastric mucosa at a sub-cellular resolution. It has prospects to be applied to the diagnosis of various gastric diseases, especially all kinds of gastric cancers.
4.4. Esophageal cancer
The epithelial structure of esophagus has been studied a decade ago using spectrum-resolved TPM.50 However, TP-FLIM imaging studies related to esophageal cancers have not been reported yet.
Based on fresh human esophageal mucosa specimens, we recently performed a comparative study on esophageal squamous cell carcinoma and the adjacent normal tissue using the spectrum-resolved TP-FLIM imaging system described above (Fig. 8). All the patients who participated in the study provided their written informed consent, and the experimental procedures were performed under the supervision and approval of the Ethics Committee for Human Research, Peking University Shenzhen Hospital. A structure of stratified squamous epithelium (characterized by the gradually varying cell morphology and density as the depth increases) as well as the papillae of normal esophageal mucosa are clearly observed in TP-FLIM images. In contrast, the squamous cell carcinoma tissue is composed of aggregated tumor cells and has lost the stratified epithelial structure. Comparing with the normal epithelial cell, the tumor cell has a remarkably higher nucleo-cytoplasmic ratio. More importantly, the cancerous tissue shows a shorter fluorescence lifetime relative to the normal tissue (Fig. 8(a)), although there is no significant difference between the fluorescence spectra of normal and cancerous tissues except for the presence of collagen SHG signals around the tumor nest (Fig. 8(b)). Since a 750nm wavelength was used to mainly excite NADH fluorescence signal in this study, we infer that the difference in fluorescence lifetime is an indicator of metabolic variation from normal to cancer.
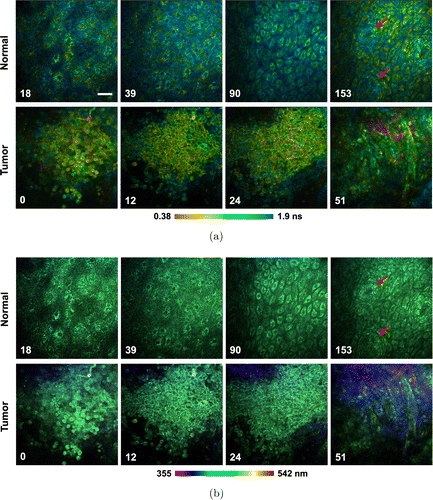
Fig. 8. Two-photon excitation fluorescence lifetime and spectral imaging of the fresh human esophageal squamous cell carcinoma tissue and adjacent normal tissue. (a) Fluorescence lifetime-coded images. (b) Fluorescence spectra-coded images. The depth is labeled in μm on the bottom left corner of each panel. The red arrow indicates the papillae. Scale bar, 50μm.
All the above reports illustrate that the two-photon excitation autofluorescence signal could be used to identify normal, precancerous, and cancerous tissues from digestive tract. Both the morphological and biochemical characteristics of digestive tract tissues can be revealed using fluorescence spectrum and fluorescence lifetime information. Therefore, TP-FLIM is promising to be developed into a powerful diagnostic tool for digestive tract tumors. However, this technology has been mainly applied in researches on oral and colorectal cancers so far; studies focussing on other digestive tract tumors, such as gastric and esophageal cancers, are seldom and need to be further explored. On the contrary, the major attention of TP-FLIM imaging studies on digestive tract tumors has been paid on the metabolism-related optical biomarkers, NADH and FAD, so far. Further exploration on other tumor-related endogenous fluorophores as well as clinically available exogenous fluorescent markers is necessary and extremely valuable.
5. Clinical Application Prospect of TP-FLIM
TPM is known for its capacity for sub-cellular resolution, intrinsic axial sectioning, superior tissue penetration depth, low photobleaching and phototoxicity, and noninvasive label-free imaging.6,7,8 FLIM is capable of distinguishing different fluorophores. It provides accurate quantitative measurement of living cells and tissues to reveal their biochemical properties.10,13,14 The combination of these two technologies, TP-FLIM, provides a powerful tool for noninvasive, label-free, structural and functional, intravital imaging of biological systems. With the excellent performance, the TP-FLIM technology has great clinical application prospects in tumor detection. However, currently the commercial TP-FLIM systems, such as DermaInspect16,51 and MPTflex21 (JenLab GmbH), are designed only for clinical skin lesion detection and other superficial imaging applications. Clinically available TP-FLIM for digestive tract tumor detection is scarce, since the clinical transformation of TP-FLIM still faces many challenges so far. Specifically, the challenges mainly involve the following three aspects.
5.1. Complex and bulky hardware system
TP-FLIM system is really complex and has strict requirements for the light source, detector, and so on. Thereby, the overall cost is relatively high.10,52 In addition, its bulky hardware system limits the flexibility of the technology for clinical diagnosis applications. Particularly for the detection of digestive tract tumors, the detection module must be developed into a fiber optic endoscopic probe and should be integrated with conventional digestive tract imaging devices such as gastroscope or colonoscope.
5.2. Time-consuming data acquisition and analysis
Limited by the tissue’s autofluorescence signal intensity and the system’s detection efficiency, it usually takes a few seconds to acquire a high-quality TP-FLIM image. To obtain a 3D TP-FLIM image stack, tens of minutes are required.10 It is time-consuming. Administrating exogenous fluorescent markers into the tissue may alleviate this problem due to their strong fluorescence intensity. However, the breakthrough in imaging speed of this technology still depends on the further improvement of the detection efficiency or the development of novel detectors. In contrast, the TP-FLIM data analysis is also time-consuming. Frequency domain analysis without fitting the fluorescence decay curve, such as fluorescence lifetime phasor plot,53 is expected to increase the data analysis speed. Besides, the fluorescence decay information of tissues is often difficult to interpret and controversial.10 The clinical application of TP-FLIM depends on further investigations on the correlation between fluorescence lifetime information and the physiological and pathological features of tissues as well as the massive accumulation of clinical data.
5.3. Restricted tissue penetration depth
TPM uses a near-infrared light for excitation, which exhibits lower scattering and absorption in biological tissues compared with visible light, resulting in deeper tissue penetration relative to single-photon imaging techniques.6 Despite this, the imaging depth is still restricted to a few hundred microns. Thereby, the TP-FLIM can only detect cancers occurring in the skin or mucosal surface. Combining with techniques such as adaptive optics and intravital tissue optical clearing will significantly improve the penetration depth of TP-FLIM. In contrast, integrating with other technologies that can provide deep-tissue information, such as ultrasound and photoacoustic imaging, to form novel multimodal imaging systems is expected to expand the diagnostic capability of TP-FLIM.
6. Summary
TP-FLIM is capable of providing high-resolution 3D structural and biochemical information of living tissues. Based on detecting fluorescence signals from endogenous fluorophores, this technology has the potential to identify normal and cancer cells. At present, a few studies based on TP-FLIM have been carried out to detect digestive tract tumors, such as oral cancers and colorectal cancers, and a trial of clinical transformation has emerged. We performed researches on the identification of gastric cancers and esophageal cancers utilizing a spectrum-resolved TP-FLIM system. The findings strongly confirm the potential of this technology for the diagnosis of digestive tract tumors in clinics. However, the deficiency of the software and hardware systems, the restriction of the imaging principle, as well as the lack of massive accumulation of experimental researches lead to significant challenges in the clinical transformation of TP-FLIM. In the future, relying on the development of novel fluorescence lifetime detection techniques, molecular-level exploration of the correlation between fluorescence lifetime variation and biological processes, as well as close collaboration between clinicians and instrument developers, TP-FLIM is promising to be used for clinical diagnosis of digestive tract tumors.
Conflict of Interest
The authors declare that there are no conflicts of interest related to this article.
Acknowledgment
We acknowledge the financial supports from the National Key Research and Development Program of China (2017YFC0110200), Program 973 (2015CB755502), the National Natural Science Foundation of China (NSFC) (81571724, 81701744, 81822023), the Natural Science Foundation of Guangdong Province (2014A030312006, 2017A030310308), the Scientific Instrument Innovation Team of Chinese Academy of Sciences (GJJSTD20180002), the Shenzhen Science and Technology Program (JCYJ20170818164343304, JCYJ20170818155006471, JCYJ20160608214524052, JCYJ20180507182432303), and the SIAT Innovation Program for Excellent Young Researchers (201821).


