Photodynamic diagnostics of early gastric cancer: Complexity measures of gastric microcirculation and new model of metastatic adenocarcinoma of rat stomach
Abstract
The detection of early gastric cancer that often develops asymptomatically is crucial for improving patient survival. The photodynamic diagnosis (PDD) of gastric cancer using 5-aminolevulinic acid/protoporphyrin IX (5-ALA/PpIX) has been reported in several studies. However, the selectivity of PDD of gastric tumor is poor with often false-positive results that require the development of new methods to improve PDD for early gastric cancer. Therefore, a measure of the complexity of gastric microcirculation (multi-scale entropy, MSE) and the detrended fluctuation analysis (DFA) were applied as additional tools to detect early gastric cancer in rats.In this experimental study, we used our original model of metastatic adenocarcinoma in the stomach of a rat. To induce a gastric tumor, we used a long-term combination (for 9 months, which is 1/2 of the life of rats) of two natural factors, such as chronic stress (overpopulation being typical for modern cities) and the daily presence of nitrites in food and drinks, which are common ingredients added to processed meat and fish to help preserve food.
Our results clearly show that both methods, namely, PDD using 5-ALA/PpIX and complexity/correlation analysis, can detect early gastric cancer, which was confirmed by histological analysis. Pre-cancerous areas in the stomach were detected as an intermediate fluorescent signal or MSE level between normal and malignant lesions of the stomach. However, in some cases, PDD with 5-ALA/PpIX produced a false-positive fluorescence of exogenous fluorophores due to its accumulation in benign and inflammatory areas of the mucosa. This fact indicates that the PDD itself is not sufficient for the correct diagnosis of gastric cancer, and the use of additional characteristics, e.g., complexity measures or scaling exponents, can significantly improve the diagnostic accuracy of PDD of gastric cancer that should be confirmed in further clinical studies and applications.
1. Introduction
Stomach cancer often develops asymptomatically, and therefore, it is diagnosed only during the late stages of the disease, which explains the high mortality rate among such patients.1,2,3,4 Worldwide, gastric cancer accounts for about 10% of all cancers and is ranked as the 2nd most common cause of death from cancer in 2018.1,2,3,4 Conventional treatments, including surgery, chemotherapy and radiation therapy, are not effective enough. In fact, recurrences occur in 50% of cases and in patients with a 5 year survival rate of about 20%. Thus, the detection of an early gastric tumor, i.e., without metastasis and deeper penetration into the submucosa, is crucial for improving patient survival.
The clinical significance of photodynamic diagnosis (PDD) of gastric cancer using 5-aminolevulinic acid/protoporphyrin IX (5-ALA/PpIX) has been reported in several publications.5,6 5-ALA itself is not a fluorophore, but a precursor of fluorescence-emitting protoporphyrin IX (PpIX), which accumulates specifically in tumor cells and emits fluorescence when the tumor is irradiated with excitation light at the appropriate wavelength.7
However, the main limitation of PDD success is the relatively poor tumor selectivity after the administration of the photosensitizer. PDD of early-stage of gastric tumors continues to improve owing to technological advances in endoscopy, but some tumors are still missing.8 Thus, PDD itself is not sufficient to improve the detection rate of gastric tumors, and effective additional methods are needed that will increase the diagnostic effectiveness of PDD.
A measure of the complexity of gastric microcirculation can be a new strategy in improving the PDD of stomach cancer. In our previous studies, we clearly showed that the wavelet analysis of gastric microcirculation provides an effective prognosis of vascular accidents in the stomach associated with acute bleeding ulcers.9 We also demonstrated an application of complexity measures of gastric microcirculation for noninvasive real-time analysis of the activity of the nitrergic (NO) system in the vascular endothelium.10 On the basis of these data, we developed a new clinical method for non-invasive stopping of re-bleeding from acute gastroduodenal ulcers using the NO synthase blocker, including patients with gastric cancer.10
The absence of optimal animal models partly explains a small progress in developing effective diagnostic methods for the early detection of gastric cancer. There are many chemical-induced and genetically modified mouse models that have revolutionized our understanding of how genes, diet, infections and carcinogens cause gastric cancer.10,11,12,13,14,15,16 However, these models are far from real life situations, they do not provide a deep understanding of the mechanisms underlying the tumor development in the stomach, and do not allow studying the early stages of cancer, as well as its metastatic activity.
In our preliminary work, we developed a new original model of highly heterogeneous adenocarcinoma in the stomach of rats with metastasis. To induce a gastric tumor, we used a long-term combination (for 9 months, which is 1/2 of the life of rats) of two natural factors, such as chronic stress (overpopulation typical for modern cities) and the daily presence of nitrites in foods and drinks, which are a common ingredient added to processed meats and fish that helps preserve the food.17
Using our rat model of highly heterogeneous adenocarcinoma, we investigated in this study the effectiveness of PDD for the early detection of gastric cancer using 5-ALA/PpIX and analysis of the complexity/correlations of the gastric microcirculation.
2. Materials and Methods
2.1. Experimental studies
Experiments were performed in mongrel male rats (250 to 300g) in accordance with the Guide for the Care and Use of Laboratory Animals published by the US National Institutes of Health (NIH Publication No. 85-23, revised 1996), the protocols were approved by the Institutional Review Boards of the Saratov State University (Protocol 7, 07.02.2017). The rats were housed at 25±2°C, 55% humidity, and 12:12h light-dark cycle. Food and water were given ad libitum.
The experiments were carried out on adult male rats (n=180). To induce gastric cancer in rats, we used the original model of highly heterogeneous gastric adenocarcinoma.17 The rats underwent to chronic stress (overpopulation for 9 months) and a diet including daily consumption of toluidine (2g/kg) in food and water with nitrites (2g/l).
Experimental groups included: (1) healthy rats (n=20) that lived in standard conditions; (2) experimental rats (n=160) were subjected to stress + diet (toluidine + nitrites). Basis on the histological data, the experimental group was divided into three subgroups: (i) an early (pre-cancer) stage, including rats with dysplasia of the basal glands of the stomach; (ii) a late stage of gastric tumor, including rats with a highly heterogeneous gastric metastatic adenocarcinoma and (iii) animals that have not shown cancerous changes in the stomach, but have inflammatory injures such as ulcers and gastritis. We did not include groups with a single stress or diet, because we presented these data in our previous work and clearly showed that in these groups there is no development of cancer.17 All rats from the control and experimental groups were treated with 5-ALA/PpIX for PDD. Some rats from the vehicle group (n=10) were treated with physiological saline 0.9% in the same volume as the photosensitizer.
Histological assay was performed to analyze changes in the gastric tissues. Samples were fixed in 10% buffered neutral formalin. Formalin-fixed specimens were embedded in paraffin, sectioned (4μm) and stained with haematoxylin and eosin. Histological sections were evaluated by light microscopy using a digital image analysis system Mikrovizor medical μVizo-103 (LOMO, Russia).
For photodynamic diagnosis of gastrointestinal tumor and organ metastasis, we used 5-ALA (20mg/kg, ALASENS, Niopik Inc., Moscow, Russia). The photosensitizer was dissolved in physiological saline and given to rats by oral gavage (the volume dose–100μl/250g).
PDD was performed 2h after treatment rats with 5-ALA/PpIX, when the photosensitizer accumulated in the gastric tissues and induced PpIX generation. Different groups for observations of human stomach carcinoma lesions with exogenous PpIX fluorescence used from 2 to 6h between the administration of PpIX precursor–5-ALA and endoscopic fluorescent observations. However, the group of Prof. Loshenov has found and recommended the most optimal regime of fluorescence observations after application of 5-ALA, namely, the time period from 2 to 4h after administration and a dose of the drug of 20mg/kg for optimal discrimination of different stomach lesions, including those with carcinoma.18
In all experiments, an excitation source at 405nm was used to detect the exogenous fluorescence signal from photosensitizers. It is based on an light-emitting diode (LED) source AFS-405 (Polironik Ltd., Moscow, Russia), with FWHM = 20nm and an output light power of 25mW. Spectral detection was carried out by microspectrometer USB4000 (OceanOptics inc., Dunedin, USA), with a spectral range of 350–1000nm. A Y-form optical fiber probe (6+1) was used to deliver excitation and emission light from the tissues investigated. From each tissue site, 7 to 10 spectra were detected, which were averaged per animal. The spectral data, verified by histological analysis, were averaged by type of tissue, and the final evaluation of the differences between tissue pathologies and the normal state of the tissue was made using values of the averaged spectral intensities.
Microcirculatory blood flow of the gastric mucosa was studied using the laser Doppler flowmetry (LDF, laser diagnostic complex LACC-2011, Moscow, Russia). The light from the HeNe laser (635nm wavelength) was focused on the tissue using an optical fiber, and the back-scattered light was detected by a pair of fibers with a separation of 0.5mm. For an LDF probe in anesthetized rats with ketamine (Sigma Chemical Co, 40mg/kg, iv), the abdomen was opened through a midline incision and the stomach was gently exteriorized. The forestomach was opened along the greater curvature, and the rat was placed on the left side. To eliminate the motion artifacts, the stomach was stabilized by placing it on a Perspex stage. The tip of either probe was positioned at about 0.5–1mm from, and perpendicular to the surface of the gastric mucosa. The duration of the recovering process was at least 1h after surgical preparation until the blood flow through the mucosa was stabilized.
2.2. Complexity analysis
Pathological changes in the dynamics of physiological systems are often identified on the basis of different complexity measures. Among these measures, various definitions of entropy are widely applied. There is a direct relationship between changes in entropy and complexity, although it is usually unclear, which definition is preferable to use. The multiscale entropy (MSE) considered in our study is related to measures that perform a characterization of the data acquired, depending on the time scale. The latter is important when it is necessary to analyze the mechanisms responsible for pathological changes that are scale-dependent. Following the work,19 MSE is suitable for characterizing complexity in accordance with its intuitive definition. The MSE is preferable to measures that quantify the complexity of the entire time series, i.e., without relation to specific time scales. The algorithm of the method can be treated as an extension of the sample entropy (SampEn), which is applied to study irregularities in experimental data sets. Since the latter approach is an improved version of approximate entropy (ApEn), MSE represents its further improvement. Within MSE, the sample entropy is computed over a wide range of scales.
The algorithm involves a coarse-grained processing procedure, when new time series yj(τ) are introduced by averaging the initial data set xi. The length τ of the window used for averaging varies with the scale
2.3. Correlation analysis
Correlation analysis of physiological time series is restricted by their nonstationarity and difficulties in characterizing the power-law behavior for rapidly decreasing correlation function. The detrended fluctuation analysis (DFA) eliminates such problems by transition to the signal profile and its detrending, i.e., removing low-frequency variations.22 A random walk (the “profile” of the signal x(i),i=1,…,N) is constructed as
3. Results
3.1. Histological data
Using our original model of gastric cancer in rats, we clearly showed the development of a gastric tumor in 9 months of animal life under a combination of chronic stress (overpopulation) and a diet with nitrites + toluidine. Histological data revealed the symptoms of highly heterogeneous gastric adenocarcinoma in 73% of rats (117 of 160) (Fig. 1(a)). Tumor lesions were accompanied by the migration of metastatic tumor cells through the bloodstream in the liver (Fig. 1(b)). The number of metastatic nodes varied from 1 to 5. In other 18% of rats (29 of 160), we observed dysplasia of the basal glands of the stomach that is a precancer indicator (Fig. 1(c)). 9% of rats (12 of 160) demonstrated the development of ulcers and gastritis without precancerous or cancerous changes in the stomach. Normal gastric tissue is presented in Fig. 1(d).
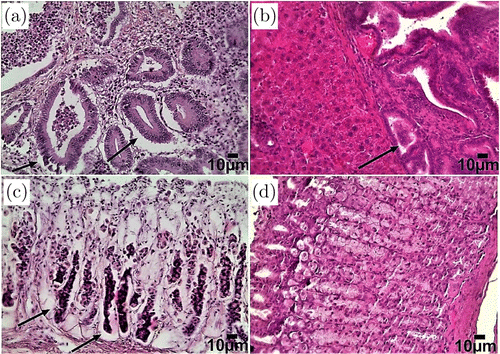
Fig. 1. Histological analysis of the tissues of the stomach and liver in normal rats living under standard conditions and in rats underwent chronic stress and receiving nitrites and toluidine in water and food for 9 months: (a) adenocarcinoma of the stomach with high heterogeneity (indicated by an arrow), (b) metastasis (indicated by the arrow) in the tissues of the liver, (c) dysplasia of the basal glands of the stomach (marked with an arrow) that is a precancer indicator and (d) normal gastric mucosa. Hematoxylin and Eosin staining. Bars represent 10m (246.4X).
Based on histological data, we divided the rats into three sub-groups: (i) early (precancer) stage, including rats with dysplasia of the basal glands of the stomach; (ii) late stage of gastric tumor, including rats with highly heterogeneous gastric adenocarcinoma; (iii) animals, which did not demonstrate cancerous changes in the stomach, but had inflammatory injures such as ulcers and gastritis. The control group included normal rats living under standard conditions. Thus, the histological data was used as the gold standard for evaluating the results obtained from PDD and measuring the complexity of gastric microcirculation.
3.2. Photodiagnosis of early gastric cancer in rats
To assess the boundaries of the cancer areas, 2-D images were made in the fluorescent mode for each organ investigated. The observed red spots corresponded to exogenous fluorescence of 5-ALA/PpIX. The blue signal is associated with endogenous fluorescence of healthy mucosa and corresponds to the signal from elastin, collagen and coenzymes NADH and flavins, which are emitted in the blue-green spectral region (Fig. 2(a)). Accumulation of 5-ALA/PpIX in the affected areas was also found in the liver, and exogenous emission was used as an indicator of pathological changes (metastatic invasion) in the liver tissues. The blue-violet fluorescence shows normal liver tissue, and the red fluorescent spots correspond to metastases (Fig. 2(b)). No fluorescence was observed at 630–710nm in a gastric tumor from the vehicle group, i.e., from rats, which were treated with physiological saline instead of 5-ALA/PpIX.
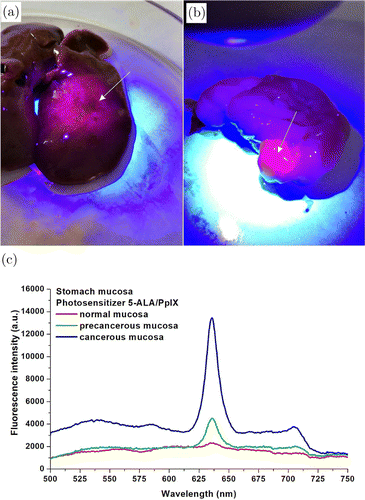
Fig. 2. Photodiagnosis of gastric cancer in rats with highly heterogeneous adenocarcinoma using 5-ALA/PpIX: (a) photo-analysis of fluorescence from normal and cancerous areas of the stomach (marked by arrow). The normal mucous membrane emits a bright blue signal compared to the red fluorescence emitted from the cancerous areas of the stomach (marked with an arrow), (b) the same from the liver and (c) comparison of the fluorescence spectra of normal, precancerous and cancerous stomach mucosa after photosensitization with 5-ALA/PpIX.
The spectra were measured in the center and on the periphery of the fluorescent areas of intact and affected tissues. A total of 280 fluorescence spectra were measured, 120 of them at points of the normal mucosa, 160 in abnormal areas of the mucosa. The maximum difference in the accumulation of 5-ALA/PpIX in the anomalous areas with well-expressed fluorescence was observed in the region of 630–710 nm with specific maxima of green 5-ALA/PpIX revealed at 635 and 704nm (Fig. 2(c)). The integral intensity of the endogenous fluorescence of the normal gastric mucosa is higher in the visible region of the spectrum. The fluorescent image of the stomach ex vivo consists of blue fluorescent normal mucous membrane, and red fluorescence spots emitted from the cancer areas of the stomach.
Fluorescence of exogenous fluorophores is also observed if precancerous changes or inflammations have occurred, which is a typical situation when 5-ALA/PpIX is used to detect gastrointestinal tumors, which leads to false-positive results for the detection of malignant tumors. However, according to the level of intensity, a much lower fluorescence signal was detected in precancerous sites compared to malignant ones, which allows distinguishing them using one-dimensional spectroscopic measurements.
The most important result was the fact that precancerous changes (dysplasia of the basal glands of the stomach), which were subsequently confirmed histologically, were also detected in the course of PDD. In this case, the fluorescence intensity was intermediate between normal and malignant lesions of the stomach (Fig. 2(c)). We have found that the peak of the brightest changes, i.e., the most significant fluorescence values for these tissues, was in the range of 625–650nm. In the normal mucosa, the peak of autofluorescence in the region of 480–530nm is most noticeable, where the signal is caused mainly due to the cross-links of the protein and the presence of flavins in the gastric tissues.
3.3. Complexity measures and correlation analysis
Analysis of experimental data was started from complexity measures estimated within the MSE-method. SampEn was computed in a wide range of scale factor — from 1 to 20. According to Fig. 3, the control group and the group of rats with a high level of fluorescence signal in stomach are separated if the scale factor is selected in the range 5–20 (p<0.05 according to the Mann–Whitney test). Further, we used the scale factor 10, although similar results are obtained for other values of this quantity.
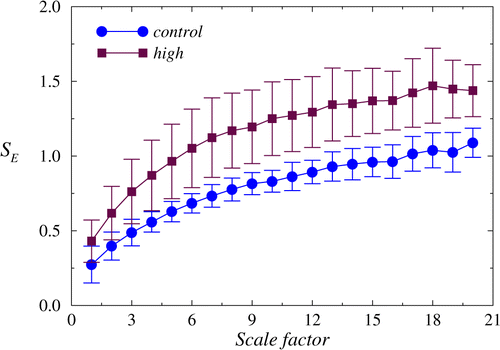
Fig. 3. The dependencies of SampEn from the scale factor are distinguished between the control recordings and data related to a late stage of gastric tumor (high level of the fluorescence signal), especially for large scale factors.
To perform computations of SampEn for a variety of scales, two parameters should be selected: the length of pattern m and the criterion of similarity r. By default, they are chosen as m=2 and r=0.15. These default values were used in our estimations.
Detrended fluctuation analysis also shows a distinction between these states based on the scaling exponent α that demonstrates differences in the long-range correlations for the related signals (Fig. 4).
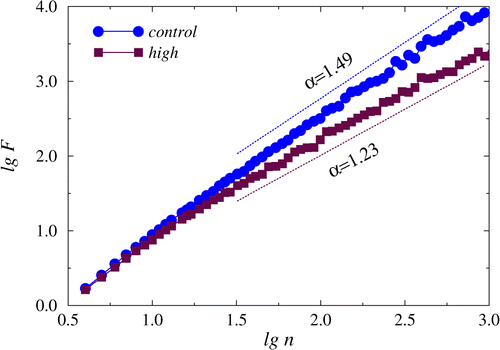
Fig. 4. The dependencies of lgF versus. lgn showing different slopes in the region of long-range correlations between control recordings and recordings related to a late stage of gastric tumor.
Statistical analysis of the experimental data (Fig. 5) confirms that the distinctions in the signal complexity analyzed with the MSE-approach and in the correlation properties described by the scaling exponent α take place not only during late stage of gastric tumor but also for an early (precancer) stage, including rats with dysplasia of the basal glands of the stomach.
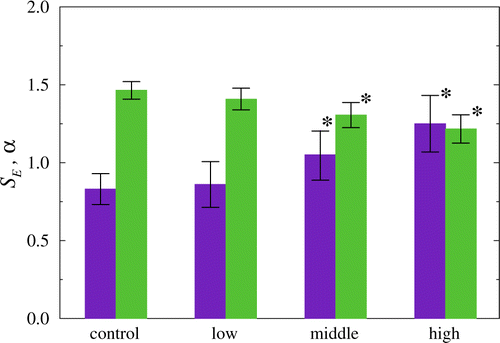
Fig. 5. Statistical analysis of the complexity measure SampEn (SE, violet) and the scaling exponent of the DFA-approach (α, green) at the transition from the control state to a late stage of gastric tumor. Both approaches provide identification of the precancer stage (p<0.05 compared to control state).
4. Discussion
In this experimental work, we clearly show the effectiveness of detecting precancer changes in the rat stomach using PDD with 5-ALA/PpIX and complexity measures or correlation analysis of gastric microcirculation. Here, we selected a rat model of metastatic highly heterogeneous adenocarcinoma. The choice of an animal model for preclinical studies is crucial for the correct interpretation of the data obtained and for the further translation of the results into clinical practice.11,12 There are about 70 different animal models reproducing gastric cancer.11,12 However, none of them can give a real scenario of tumor development in the stomach, because these models are based on the use of aggressive chemical agents,13,17,23,24 Helicobacter invasion14 or mutation of genes15,16 that are not suitable for a real life situation, where chronic stress, etiological and ecological factors, including food quality, play the most important role in carcinogenesis.25,26,27,28,29,30,31 Zali et al.31 discussed that, while intestinal gastric cancer is strongly associated with chronic H. pylori, this strong link is not observed with diffuse gastric cancer. Diffuse or cardiac gastric cancer, however, was associated with other risk factors such as the higher socioeconomic classes32 and obesity.33,34
Using social chronic stress, such as overpopulation that is typical for modern cities, and daily diet with nitrites + toluidine, which are also a common food ingredient, we have demonstrated a highly reproducible model of metastatic adenocarcinoma of the stomach in rats at different stages of the formation of this tumor from precancerous changes (dysplasia of the basal glands of the stomach) in 18% of rats until late cancerous injures in 73% of animals.
Thus, using this model, we had a good informative platform for analyzing early and late cancerous changes in the stomach to investigate these changes using PDD and data processing techniques considered in this study (MSE and DFA).
For PDD of adenocarcinoma in rats, we used 5-ALA. For the first time, the clinical use of 5-ALA for PDD of various types of brain cancer has been demonstrated by Moore et al.35 in 1948. Recently, PDD with 5-ALA is widely used for many types of tumors, including gastrointestinal cancer.3,35,36 5-ALA is an essential amino acid synthesized from succinyl-CoA and glycine by ALA-synthase in mitochondria, which converts 5-ALA into PpIX, followed by conversion to heme in normal cells.7 PpIX is photoactive and emits red fluorescence when irradiated with excitation light in the 400–410 nm range.38 In cancerous tissues, PpIX synthesis is highly activated, and the enzyme (ferrochelatase) that converts PpIX into heme, is downregulated. Therefore, PpIX is accumulated specifically in the tumor cells.7 The half-life of 5-ALA is 1.5h, therefore, it can be used without the incidence of photophobia.5,7
Our PDD data clearly revealed significant differences between normal, precancerous and malignant changes in the rat stomach. The fluorescence from malignant tumors in the organ was maximal at 635 nm, where the maximum emission of protoporphyrin is located due to the high accumulation of the photosensitizer in the tissues, which is also discussed in an earlier work.39 Similar spectra of the emitting fluorescence of PpIX with peaks at 635nm have been shown for PDD of various types of cancer, including glioblastoma,38 gastric cancer,5,35,36,40 basal cell carcinoma.41
The fluorescence intensity in precancerous cases was intermediate between normal and malignant lesions of the stomach. The most significant fluorescence values for 5-ALA/PpIX were in the range of 625–650nm. In the normal mucosa, a bright autofluorescent peak is observed in the region of 480-530nm, where a signal is present mainly from cross-links of protein and flavins. Our results are consistent with human clinical studies, which also showed that PDD using 5-ALA provides good visualization and detection of early gastric cancer.5,36,37 However, specifically for the stomach, the fluorescent detection rate is only 53.8%, while this rate is much higher for esophageal tumors (85%).42 Nakamura et al.6 discussed that there were no significant differences in the intensity of fluorescent signals between patients with different stages of gastric cancer. They suggested that the formation of a gastric tumor by proliferation of cancer cells is necessary for the expression of fluorescence, which is not high enough for PDD in case of precancerous changes. Therefore, further preclinical studies of PDD for early gastric cancer and the development of additional methods for improving PDD of gastric cancer are needed.
In our work, we demonstrated that scaling exponents characterizing the gastric microcirculation provide effective detection of early and late stages of adenocarcinoma in rats, which was confirmed by histological data and correlated with PDD results. Indeed, the α-values were lower in the group with adenocarcinoma and have intermediate values between normal state and gastric cancer in the group with precancerous changes in the stomach. Similar distinctions are observed when analyzing complexity with the MSE-approach. This analysis also demonstrated high sensitivity and specificity to inflammatory, precancerous and cancerous changes in the rat stomach. In the previous study on rats with acute ulcer bleeding, we demonstrated the effectiveness of complexity measures of gastric microcirculation for prognosis of the high risk of re-bleeding from acute ulcers in the rat stomach.9 Experimental data was confirmed later in our clinical studies in patients with bleeding ulcers and gastric cancer.10 We believe that the complexity of the microcirculation in the stomach may be a promising tool for improving the diagnostic significance of PDD for early gastric cancer.
5. Conclusions
Our experimental data from large groups of rats clearly demonstrate that a combination of methods such as PDD using 5-ALA/PpIX and correlation/complexity analysis of gastric microcirculation, can detect early gastric cancer, which was confirmed by histological analysis. Precancerous areas in the stomach were detected as an intermediate fluorescent signal or SampEn/α level between normal state and malignant lesions of the stomach. However, in some cases, PDD with 5-ALA/PpIX gave false-positive fluorescence of exogenous fluorophores. This fact suggests that PDD itself is not sufficient for the correct diagnosis of gastric cancer, and the application of additional data processing tools can significantly improve the diagnostic accuracy of PDD, which should be confirmed in further clinical studies.
Conflict of Interest
Authors have no conflict of interest.
Acknowledgments
This collaborative work was supported in the frames of Russian Science Foundation project #18-15-00139 “Optical technologies for early diagnostics of stomach cancer.” Fluorescence measurements were made using spectrometric system purchased in the frames of Bulgarian NSF-MES project #DFNI-B02/9/2014 “Development of biophotonics methods as a basis of oncology theranostics.”


