Fusion of clathrin and caveolae endocytic vesicles revealed by line-switching dual-color STED microscopy
Abstract
Clathrin- and caveolae-mediated endocytosis are the most commonly used pathways for the internalization of cell membrane receptors. However, due to their dimensions are within the diffraction limit, traditional fluorescence microscopy cannot distinguish them and little is known about their interactions underneath cell membrane. In this study, we proposed the line-switching scanning imaging mode for dual-color triplet-state relaxation (T-Rex) stimulated emission depletion (STED) super-resolution microscopy. With this line-switching mode, the cross-talk between the two channels, the side effects from pulse picker and image drift in frame scanning mode can be effectively eliminated. The dual-color super-resolution imaging results in mixed fluorescent beads validated the excellent performance. With this super-resolution microscope, not only the ring-shaped structure of clathrin and caveolae endocytic vesicles, but also their semi-fused structures underneath the cell membrane were distinguished clearly. The resultant information will greatly facilitate the study of clathrin- and caveolae-mediated receptor endocytosis and signaling process and also our home-built dual-color T-Rex STED microscope with this line-switching imaging mode provides a precise and convenient way to study subcellular-scale protein interactions.
1. Introduction
Endocytosis is an important cellular process for eukaryotic cells to acquire extracellular nutrition, internalize membrane receptors and signal transduction.1 In the diverse endocytic mechanisms, clathrin- and caveolae-mediated endocytosis are the main ways in which receptors enter cells.2 Due to their small size (less than 200nm in diameter) and imaging technology limitations, although it is well recognized that clathrin-coated pits and caveolae vesicles are separately located invaginations at the plasma membrane,3,4 their interactions underneath the cell membrane is less understood. Therefore, a dual-color super-resolution fluorescence microscope will be of great help. In the past 10 years, stimulated emission depletion (STED) super-resolution microscopy has been rapidly developed and widely used in biological research.5,6,7 And many significant new findings have been obtained in the study of intracellular protein distributions and subcellular structure changes due to its ultra-high resolution and fast imaging.8,9 More than that, dual-color STED super-resolution microscopy plays a more important role in studying the interactions between different biological components for better understanding the molecular mechanisms of cellular physiological processes.10,11 Researchers have built dual-color STED microscopes with two kinds of configuration mainly. For the first one, the two types of fluorophores have distinct excitation and emission spectra, thus two pairs of excitation and depletion laser beams were required during dual-color STED imaging.12,13 For the second one, the two types of fluorophores have similar emission spectra but different excitation spectra, thus two excitation beams and one depletion laser beam were used during dual-color STED imaging.14 Regardless of which of the two configurations is chosen, it will inevitably face two important issues, cross-talk and image drift between the two imaging channels. In addition, photobleaching is a common problem for all STED super-resolution imaging due to the triplet-state or dark-state relaxation (T-Rex or D-Rex) effect of fluorescent dyes. Therefore, a T-Rex illumination scheme, which the subsequent excitation pulse reaches the sample in no shorter than 1μμs, has been proposed to reduce photobleaching by reducing the probability of exciting fluorescent molecules transitioning to the triplet state.15,16
To eliminate the cross-talk between the two color channels, three categories of separation method have been proposed, namely, the spectral separation, the image post-processing separation and the temporal separation. In the spectral separation method,17 fluorescent filters were used to reduce the unwanted fluorescence from another channel, but the cross-talk cannot be eliminated completely. The image post-processing method,18,19,20 by using an algorithm to evaluate the contribution of each fluorescent molecule to each color channels, then to separate them linearly, cannot completely eliminate the cross-talk yet, and always produce artificial signals. The temporal separation,14,21 by gating the two color channels alternately, can eliminate the cross-talk completely, and is the most reliable and commonly used method. For temporal separation, the gating pulse should be set according to the scanning imaging mode, namely, the frame scanning or pixel scanning.14,22 In the frame scanning imaging mode, one color channel should be switched on and another should be switched off until one frame of the active color channel is completed. In this way, it is difficult to achieve synchronous imaging of the two color channels. Worse still, and there will always be obvious image drift between the two color images, making it impossible for co-localization studies. In general, pixel scanning mode is the optimal scanning mode to eliminate image drift, in which, the same pixel of the two color channels is scanned in succession and the synchronization of the two channels can be guaranteed. However, a special pulse selection system (such as pulse picker with larger than 1 MHz gating frequency) is required to regulate the pulse frequency and alternate excitation in pixel scanning.23 Unfortunately, in practice, the pulse picker always generates some side effects, such as wavefront distortion, large loss of pulse energy, the incompleteness of suppressing unwanted pulse (Fig. S1), makes it difficult (even failed) to get optimal super resolution.
Herein, in this paper, a line-switching imaging mode between different channels has been achieved, in which only about 10kHz gating frequency is required and can be obtained easily with mechanic shutters or choppers. Then the cross-talk between the two channels, the side effects from pulse picker and the image drift from frame scanning mode can be effectively eliminated. In addition, a supercontinuum pulsed laser is used for the dual-color line-switching STED super-resolution imaging. Not merely its pulse repetition rate (1MHz) is more suitable for T-Rex STED illumination scheme, but also its natural pulse synchronicity can ensure the same image quality after a long period of imaging, and its spectral range can provide almost all the excitation and depletion light over the entire visible range.24,25 With this home-built line-switching dual-color T-Rex STED microscope, we not only observed the ring-shaped structure of the clathrin and caveolae endocytic vesicles, but also their fusion state at different stages underneath the cell membrane. Furthermore, we found that most of the two vesicles co-localization in confocal imaging mode did not show co-localization in STED super-resolution imaging mode, suggesting that the traditional confocal microscope does not precisely reflect the location of the different components within the optical diffraction limit. Thus, it proves that our dual-color line-switching T-Rex STED super-resolution microscope provides a more precise and convenient way to study subcellular-scale protein interactions.
2. Materials and Methods
2.1. Fluorescent beads immobilization
To prepare the fluorescent beads sample for STED imaging, the microscope glass slides were first cleaned in detergent, acetone, and 1M NaOH for 30min by sonication in turn, and rinsed with Milli-Q water three times after each step, and then dried by nitrogen. Fluorescent beads (Ex/Em: 580/605nm, Ex/Em: 660/680nm) 40nm in diameter were obtained from Thermo Fisher Scientific. The diluted (1:10−5−5) fluorescent beads were dispersed on the cleaned glass slides, and then dried naturally.
2.2. Cell culture and sample preparation for imaging
Hela cells were cultured in Dulbecco’s modified Eagle’s medium (DMEM, Gibco) supplemented with 10% fetal bovine serum (Hyclone) and antibiotics (50mgmL−1−1 streptomycin, 50UmL−1−1 penicillin) at 37∘C in a 5% CO2 atmosphere.
For microtubule imaging: Cells were fixed in 4% formaldehyde for 30min at 4∘ temperature and then permeabilized in 0.5% Triton X-100 and 3% formaldehyde at 4∘C temperature for 30min. Then the cells were washed with PBS buffer for three times and incubated in the blocking buffer (0.5% bovine serum albumin) for 30min. After that, the cells were incubated with the diluted primary antibody (Anti-αα-Tubulin antibody, 1:200, Sigma-Aldrich) at 4∘C overnight, washed with PBS for three times, and then incubated with the diluted ATTO 594 and ATTO 647N-conjugated secondary antibody (1:200, Sigma-Aldrich) in PBS buffer at 4∘C for 1h.
For clathrin and caveolae endocytic vesicles imaging: After the Hela cells were fixed and permeabilized, they were incubated with the diluted primary antibody (Anti-clathrin or Anti-caveolin-1 antibody, 1:200, BD Biosciences) at 4∘C overnight, washed with PBS for three times, and then incubated with the diluted ATTO 594 or ATTO 647N-conjugated secondary antibody (1:200, Sigma-Aldrich) in PBS buffer at 4∘C for 1h.
2.3. Line-switching dual-color T-Rex STED setup
All the confocal and STED imaging was performed by our home-built dual-color STED microscope, with a similar structure as we previously reported.26,27,28,29 In the dual-color STED imaging configuration, two excitation beams shared the same STED depletion beam. The microscope was based on a commercial Olympus IX71 microscope equipped with a 100 × 1.40 NA objective and a microscopy scanning stage (P-545, PI, Germany). A supercontinuum fiber laser (SC-450 HP, Fianium, Southampton, UK), which covers the spectrum region from 450nm to 1750nm, was used to provide both of the excitation beams Exc1 (576/10nm) and Exc2 (647/2.5nm), and also the STED depletion beam (760/12nm). To achieve super-resolution imaging, a vortex phase plate (RPC Photonics, USA) with a helical phase ramp of 2ππ was used to create a focal doughnut. In order to better separate the excitation and emission channels, 4 dichroic filters (Chroma Technology Corporation, DM1: ZT760sprdc, DM2: T635lpxr, DM3: T610spxxr, DM4: ZT647rdc) are used in the system.
In order to achieve the line-switching imaging, a timing shutter (Uniblitz LS2, Vincent Associates Inc.) was added in each of the two excitation light paths. The time delay between excitation and depletion pulses in experiments was adjusted by changing the optical path lengths. Fluorescence signal of each channel was collected through a band pass filter (FF01-624/40 or FF01-679/40), and counted by an avalanche photodiode (APD, Excelitas Technologies, USA) counter. Representatively, images of 10×10μ10×10μm were acquired with a 20nm pixel size (500 × 500 pixels) and pixel dwell times of 1ms. The average power of excitation for 576 and 647nm is about 0.1∼0.3μ0.1∼0.3μW, and for STED 760nm depletion beam is about 3mW. At last, a control program was written by ourselves to make the timing shutters, sample scanning stage and APD work together, then acquire the signals and reconstruct the two-dimensional images.
3. Results and Discussion
3.1. Development of line-switching dual-color T-Rex STED microscope
In our home-built dual-color T-Rex STED microscope, a supercontinuum pulsed laser was used to provide all the two excitation beams (Exc1: 576/10nm, Exc2: 647/2.5nm) and the shared STED depletion beam (STED: 760/12nm), and two types of fluorophores with different excitation spectrum and similar emission spectrum were used for dual-color labeling. After the imaging system was built, its resolution was demonstrated by imaging the 40nm fluorescent microspheres, and the full width at half maximum (FWHM) were 40 and 80nm for the two channels, respectively (Fig. S2).27 Notably, the FWHMs are calculated from the original data.
To eliminate the cross-talk between different channels, we implemented the line-switching imaging mode between different channels by adding two timing shutters on both excitation paths (Fig. S3). Its working principle diagram was shown in Fig. 1. First, one row of the channel 1 was scanned by switching on the channel 1 and meanwhile switching off the channel 2. The channels were switched by means of switching their corresponding shutters and detectors. In succession, the same row of the channel 2 was scanned by switching on the channel 2 and meanwhile switching off the channel 1. During all the scanning, the STED depletion beam was always kept on.

Fig. 1. Laser pulse timing diagram of line-switching time-gate cross-talk separation method. Exc1: excitation light of channel 1 with 1 MHz pulse frequency; Exc2: excitation light of channel 2 with 1MHz pulse frequency; STED: STED depletion light of the two channels with 1MHz pulse frequency; CH1: fluorescence detector of channel 1; CH2: fluorescence detector of channel 2.
The gating frequency of the line-switching mode is only one nnth (where nn is the pixel number of one scanning row) of pixel scanning mode, and a pulse selection system for high gating frequency is not obligatory. Thus, the side effects from the pulse selection system, such as the wavefront distortion, large loss of pulse energy, the incompleteness of suppressing unwanted pulse, and higher cost, are of nonentity. In addition, all the laser sources stemming from the same supercontinuum pulsed laser have natural pulse synchronization, thus maintaining good image quality after a long period of imaging.
3.2. The performance of line-switching method to eliminate cross-talk
Generally, there are two kinds of cross-talk in dual-color imaging. The first one is emission cross-talk resulting from the fluorescence signals generated by one channel seeping into another. The second one is excitation cross-talk due to the excitation laser of one channel exciting the fluorophores of another channel. As mentioned in the introduction section, both the spectral separation method and image post-processing separation method cannot eliminate the cross-talk completely. As shown in Fig. 2, about 30% of the fluorescence signals of channel 1 were detected in channel 2 with the spectral separation method (Fig. 2(b)). However, almost no fluorescence signal from channel 2 seeped into channel 1. The excitation cross-talk only with the spectral separation method was shown in Fig. S4.

Fig. 2. Cross-talk between the two channels without line-switching separation method. (a) Confocal imaging of 40nm fluorescent beads (Ex/Em: 580/605nm) excited by excitation light 1 (Exc1) and about 30% of its fluorescence signals seep into channel 2 (b). (c) The fluorescence intensity profiles of the same beads from CH1 (green) and CH2 (red). (d) Confocal imaging of 40nm fluorescent beads (Ex/Em: 660/680nm) excited by excitation light 2 (Exc2) and almost negligible fluorescence signal seep into channel 1 (e). (f) The fluorescence intensity profiles of the same beads from CH1 (green) and CH2 (red). Scale bar: 2μμm.
As also mentioned in the introduction section, although the temporal separation method can eliminate the cross-talk completely, the frame scanning imaging mode always generate obvious image drift between the two color images. As shown in Fig. S5, the same fluorescent bead drifts a linear distance of about 40nm. In pixel scanning mode, a high repetition rate pulsed laser (like femtosecond pulsed laser) is always required.23 However, in addition to the side effects introduced by pulse picker mentioned previously, its ultra-high repetition rate and narrow pulse width of the depletion laser will greatly promote the transition of fluorescence molecule to higher energy states and triplet state, thereby greatly increasing the possibility of photobleaching.15 On the whole, pixel scanning mode is not the optimal dual-color STED super-resolution imaging method. Therefore, we proposed an innovative line-switching mode in our dual-color T-Rex STED microscope.
In order to evaluate the performance of line-switching mode to eliminate cross-talk, we investigated the interference between different channels by cross-detecting the fluorescence signals of 40nm fluorescent beads. As shown in Fig. 3, two pairs of excellent confocal and STED super-resolution images of fluorescent beads (Exc/Em: 580/605nm and Exc/Em: 660/680nm) were obtained without detection of any cross-talk (Figs. 3(c) and 3(f)).

Fig. 3. The performance of line-switching method to eliminate cross-talk on imaging 40nm fluorescent beads. (a) and (b) are the confocal and STED images of fluorescent beads (Ex/Em: 580/605nm) from channel 1 detected by channel 1. (c) is the STED image of fluorescent beads from channel 1 detected by channel 2. (d) and (e) are the confocal and STED images of fluorescent beads (Ex/Em: 660/680nm) from channel 2 detected by channel 2. (f) is the STED image of fluorescent beads from channel 2 detected by channel 1. Scale bar: 2μμm.
3.3. Image drift between different channels in line-switching mode
Due to its ultra-high imaging resolution, the dual-color STED microscopy has great advantages in studying the interactions between different biological molecules or subcellular structures, but the premise is to ensure that there is no image drift between different channels. For our line-switching dual-color STED microscope, we evaluated the image drift between the two channels by simultaneously labeling the microtubules with double fluorescent probes (ATTO 594 dye for channel 1, ATTO 647N dye for channel 2). As shown in Fig. 4, microtubules from the both imaging channels suggested an excellent co-localization performance. By fitting the profiles of the two channels with Gaussian curves, we found that the co-localization accuracy of the microtubule 1 (horizontal profile) and microtubule 2 (vertical profile) is 18 and 3nm, respectively (Fig. 4(d)). Compared with the frame scanning mode, our proposed line-switching mode achieved a significant improvement on image drift. Accordingly, it proves that our home-built dual-color STED microscope with line-switching method can be used for high-precision co-localization studies at super-high co-localization accuracy.

Fig. 4. Super-resolution co-localization analysis of microtubules in line-switching STED imaging mode. (a) STED imaging of microtubules which were labeled with ATTO 594 dye by immunofluorescence. (b) STED imaging of microtubules in the same region with (a) which were labeled with ATTO 647N dye by immunofluorescence. (c) is an overlay of (a) and (b). (d) Gaussian curves in horizontal and vertical directions for co-localization analysis.
3.4. Dual-color STED imaging of mixed fluorescent beads in line-switching mode
Since the resolution of conventional optical microscopy is limited by the diffraction limit, pseudo co-localizations tend to occur when studying the positional relationship within the diffraction limit. Therefore, it is necessary to study the positional relationship of different components under super-resolution microscopy. Here to demonstrate the dual-color imaging performance of the line-switching mode more intuitively, we chose to use the mixed fluorescent beads (Ex/Em: 580/605nm for channel 1, Ex/Em: 660/680nm for channel 2) of 40nm in diameter, which are impossible to co-locate, for dual-color STED super-resolution imaging. The results showed that, not only did we get 80 and 40nm resolutions (Fig. S2) for each of the two channels, but also we achieved excellent dual-color imaging potential without any cross-talk. As shown in Figs. 5(c) and 5(f), due to the limitation of optical diffraction limit, the closer 40nm mixed fluorescent beads cannot be distinguished and exhibit an pseudo co-localization in confocal mode, but distinguishable in dual-color STED super-resolution microscope with line-switching mode. This further demonstrated that it would be more precise to study the co-localization or interaction of different components in dual-color super-resolution mode.

Fig. 5. Dual-color STED imaging of 40nm mixed fluorescent beads in line-switching mode. Confocal (a) and STED (d) imaging of 40nm fluorescent beads (Ex/Em: 580/605nm) from the mixed beads. Confocal (b) and STED (e) imaging of 40nm fluorescent beads (Ex/Em: 660/680nm) from the mixed beads. (c) is the superposition of (a) and (b). (f) is the superposition (d) and (e). The two areas marked by white dashed boxes in the lower left corners in panels (c) and (f) are magnified and displayed in the top right corners. Scale bar: 2μμm.
3.5. Semi-fused structure of clathrin and caveolae endocytic vesicle
Endocytosis mediated by clathrin and caveolae endocytic vesicles is the most commonly used endocytic pathways of cell membrane receptors.2 Therefore, it is of great significance to study the relationship between clathrin and caveolae in mediating receptor endocytosis.30 In our previous study, we found that these two endocytic vesicles could be co-localized underneath the plasma membrane by live cell fluorescence tracking.31 However, the conventional optical microscopy may not truly reflect their positional relationship within optical diffraction limit. Although the electron microscopy has a sufficiently high resolution, its complicated sample preparation process and harsh imaging conditions are not conducive to biological research under physiological conditions. Furthermore, the low efficiency of secondary immunolabeling makes electron microscopy not well suited for studying the interactions between two or more components.
To better understand the endocytosis mechanism of membrane receptor mediated by clathrin and caveolae endocytic vesicles, the endogenous proteins of clathrin or caveolin-1 in Hela cells were connected with ATTO 647N conjugated secondary antibody by immunofluorescence labeling. Then, for the first time, we observed the ring-shaped structure of clathrin and caveolae endocytic vesicles by using the ultra-high resolution of STED microscope (Fig. 6). This will greatly contribute to study the mechanism of membrane receptor endocytosis and its downstream signal transduction.

Fig. 6. STED super-resolution imaging of clathrin and caveolae endocytic vesicles. Confocal (a) and STED (b) imaging of clathrin vesicles, in which clathrin were labeled with ATTO 647N conjugated secondary antibody. Confocal (c) and STED (d) imaging of caveolae vesicles, in which caveolin-1 were labeled with ATTO 647N conjugated secondary antibody. Scale bar: 2μμm.
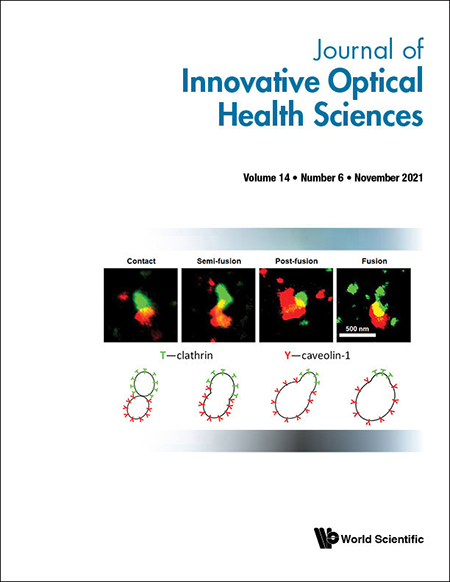
Furthermore, as mentioned earlier, to exclude the artificial co-localization and more easily study the interactions of the two endocytic vesicles within the diffraction limit, we labeled the endogenous proteins of clathrin and caveolin-1 with ATTO 594 or ATTO 647N conjugated secondary antibody simultaneously for dual-color STED super-resolution imaging. As shown in Fig. 7, we observed the semi-fused structure of clathrin and caveolae endocytic vesicle underneath the plasma membrane intuitively. Furthermore, we observed their fusion status of different stages and the clathrin protein gradually falls off during the fusion process by dual-color STED imaging (Fig. 8(a)). It would offer new information on the intracellular transportation of relevant receptor for better understanding its signaling process. In addition to this, we also observed many vesicles co-localized in confocal mode but not co-localized in STED mode (Fig. S6), which directly indicated that confocal microscopy does not reflect co-localization within the diffraction limit precisely. Therefore, our dual-color line-switching T-Rex STED super-resolution imaging afforded a more precise and convenient method for studying the locations and interactions of different components on sub-cellular scale.

Fig. 7. Dual-color STED super-resolution imaging of clathrin and caveolae vesicles. (a) Confocal imaging. (b) STED imaging. Endogenous proteins of clathrin and caveolin-1 were labeled with ATTO 594 or ATTO 647N conjugated secondary antibody simultaneously. Scale bar: 2μμm.

Fig. 8. Fusion status of clathrin and caveolae endocytic vesicles at different stages. (a) Dual-color STED imaging of clathrin and caveolae vesicles with varying degrees of fusion. (b) Schematic diagram of clathrin and caveolae vesicles with varying degrees of fusion. Scale bar: 2μμm.
4. Conclusions
In this paper, we proposed a line-switching imaging mode to eliminate the cross-talk between different channels by adding two mechanic shutters. With this scanning mode, the cross-talk between the two channels and the side effects from pulse picker can be eliminated thoroughly, and also the image drift from frame scanning mode can be greatly improved. Further, in order to reduce the photobleaching caused by the transition of fluorescent molecules to higher energy states and triplet state, we chose the supercontinuum pulsed laser which has a lower repetition rate and wider pulse width will be more conducive to us to implement the dual-color T-Rex STED microscopy. In addition, this line-switching imaging mode can be used to eliminate the cross-interference in all the scanning microscopies. With this dual-color T-Rex STED super-resolution microscope, we intuitively observed the semi-fused structure of clathrin and caveolae endocytic vesicles and the clathrin protein gradually falls off during the fusion process, which will help us to further understand the intracellular transport mechanism of different receptors and the relevant signaling process. At the same time, dual-color line-switching STED super-resolution imaging technique was proved to be more precise and convenient way to study subcellular-scale protein interactions.
Conflict of Interest
The authors declare that there are no conflicts of interest relevant to this article.
Acknowledgments
This work was supported by the CAS Key Technology Talent Program; the Instrument Incubation Program of Institute of Chemistry, CAS; the National Natural Science Foundation of China (21735006, 32000873, 22077124 and 91939301); Beijing Natural Science Foundation (5184032); the China Postdoctoral Science Foundation (2019M650718); the Chinese Academy of Sciences.