Quantitative analysis of collagen morphology in breast cancer from millimeter scale using multiphoton microscopy
Abstract
The tumor microenvironment (TME) is now recognized as an important participant of tumor progression. As the most abundant extracellular matrix component in TME, collagen plays an important role in tumor development. The imaging study of collagen morphological feature in TME is of great significance for understanding the state of tumor. Multiphoton microscopy (MPM), based on second harmonic generation (SHG) and two-photon excitation fluorescence (TPEF), can be used to monitor the morphological changes of biological tissues without labeling. In this study, we used MPM for large-scale imaging of early invasive breast cancer from the tumor center to normal tissues far from the tumor. We found that there were significant differences in collagen morphology between breast cancer tumor boundary, near tumor transition region and normal tissues far from the tumor. Furthermore, the morphological feature of eight collagen fibers was extracted to quantify the variation trend of collagen in three regions. These results may provide a new perspective for the optimal negative margin width of breast-conserving surgery and the understanding of tumor metastasis.
1. Introduction
Breast cancer is the most common cancer in women and the leading cause of cancer-related death in women worldwide. In 2020, the burden of breast cancer increased by 2.261 million new cases and 685,000 cancer deaths. Female breast cancer has surpassed lung cancer as the most commonly diagnosed cancer.1 The occurrence, development, spread and treatment of breast cancer are inseparable from the surrounding extracellular matrix. The matrix as a whole is a complex system of cells and macromolecules.2 In recent years, the alterations in the tumor microenvironment (TME) are considered to be a critical element in breast cancer development and progression.3 TME is composed of tumor cells, mesenchymal cells, immune cells, extracellular matrix (ECM), signal molecules and cytokines.4 Collagen, as the main component of ECM, has been extensively studied for its role in tumor progression.5,6 Based on the mouse breast cancer model, Keely et al. found that the collagen morphology at TME was related to tumor invasion and proposed three tumor-associated collagen signatures (TACS1-3).7 TACS1-3 presents a new method to characterize tumor development and was subsequently proved to be a prognostic biomarker in invasive breast cancer and ductal carcinoma in situ.7 Recently, our group expanded the number of TACS patterns from three to eight, further improving the prognostic ability of TACS for breast cancer.8 Since TACS is mainly used for prognosis diagnosis, it is only necessary to pay attention to the change trend of collagen within the range of about 1 mm in the front of tumor invasion, which can achieve good results. However, sometimes we need to focus on environmental variation in larger areas around the tumor. For example, for breast conserving surgery, the width of the margin in the range of several millimeters, different width of the negative edge may affect the recurrence rate.9 Therefore, large-scale monitoring of changes in the TME during the transition from tumor boundary to normal tissue from the perspective of collagen may be of great significance to understand the mechanism of tumor invasion.
Pathological examination based on hematoxylin and eosin (H&E) stains is a common method and the ‘gold standard’ for diagnosing breast diseases. Although H&E staining can diagnose the pathological state of breast diseases at cellular level,10,11 it is not convenient to observe the changes of collagen fibers in TME. Multiphoton microscopy (MPM) has emerged as a powerful imaging tool for TME due to its advantages of label-free, high beam penetration depth and small cell damage.12 MPM, based on second harmonic generation (SHG) and two-photon excitation fluorescence (TPEF), can be used to monitor the morphological changes of biological tissues without labeling.13,14,15 Some substances naturally present in intracellular and extracellular matrix in biological tissues are essentially fluorescent, which are called endogenous fluorophores. For example, niacinamide adenine dinucleotide (NADH) and flavin adenine dinucleotide (FAD) in the intracellular matrix can produce TPEF signals through two-photon excitation, which are closely related to cell metabolism. Extracellularly, collagen, myosin and micro-proteins with noncentrosymmetric structure can be stimulated by SHG signals, which can characterize physiological or morphological phenomena in vivo.16,17 Especially, SHG signal mainly comes from collagen, which makes MPM have unique advantages in monitoring the changes of collagen morphology in TME. In our previous study, we used MPM to perform large-scale imaging of a tissue slice sample with early breast cancer invasion and observed that collagen fibers changed significantly during the transformation from tumor boundary to normal tissue.18 In this study, we further calibrated the distance between the tumor boundary, the transition region and the normal tissue far from the tumor and extracted eight morphological feature of collagen fibers in these three regions. In addition, we also increased the number of case samples and statistically analyzed the morphological feature of collagen fibers in the three regions.
2. Materials and Methods
2.1. Sample preparation
This study used specimens collected from patients who underwent breast surgery at the Institutional Review Board of Fujian Medical University Union Hospital and Harbin Medical University Cancer Hospital. The Institutional Review Board of Fujian Medical University Union Hospital and Harbin Medical University Cancer Hospital approved this study. A total of 40 breast cancer patients participated in this study. In this experiment, formalin-fixed and paraffin-embedded (FFPE) early invasive breast cancer tissue samples were used. Two series slices (5 um thickness) were cut from each FFPE tissue block (about 2cm in size) by Ultra-Thin Semiautomatic Microtome in the pathology laboratory. After deparaffinized by alcohol and xylene, one section was stained with H&E stains to confirm experimental results and the other section was used for MPM imaging (as shown in Fig. 1).
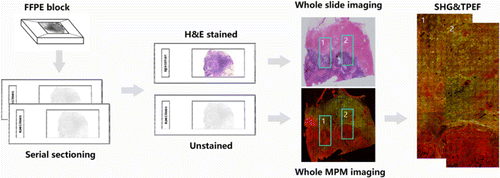
Fig. 1. Flow chart of sample preparation and MPM image acquisition.
2.2. Multiphoton microscopic imaging system
The imaging system used a commercial laser scanning microscope platform (LSM 880 Zeiss, Germany) and a mode-locked femtosecond Ti:Sapphire laser (tunable from 690nm to 1064nm). In order to obtain high-quality MPM images of breast tissue, 810nm was selected as the excitation wavelength and the scattering signals of tissue samples were obtained simultaneously through two independent channels. SHG signal was collected by one channel with a wavelength range of 395–415nm (color-coded green). TPEF signal was collected by the other channel with a wavelength range of 428–695nm (color-coded red). A Plan-Apochromat 20×objective (NA=0.8, Zeiss, Germany) was employed to acquire large field images.19,20
3. Results
3.1. Imaging of tissue sections from tumor boundary to normal tissue by MPM
Biological tissues not only consists of cells, but also have a large part of the extracellular space occupied by ECM. The fibrins in ECM include collagen, elastin, fibronectin and laminin. Among them, collagen accounts for a large part of the total protein.21 Breast TME can regulate tumor progression through extracellular matrix remodeling in tumor-associated stroma.22 TACS is considered as a biomarker associated with breast cancer prognosis. Figure 2(a) shows continuous MPM image (SHG/TPEF overlay) of early invasive breast cancer from breast tumor boundary to normal tissue. Figures 2(b) and 2(c) show respectively the SHG/TPEF overlay, SHG, TPEF and corresponding H&E stained images of the tumor boundary (yellow box region in Fig. 2(a)), near tumor transition region (white box region in Fig. 2(a)) and normal tissue (blue box region in Fig. 2(a)). Figure 2(b) shows that at the tumor boundaries, tumor cells and collagen fibers alternate, resulting in short breakage of many collagen fibers (yellow arrow in Fig. 2(b)). Figure 2(c) shows that collagen fibers in near tumor transition region have longer length and greater curvature relative to the tumor boundary, and collagen orientation still tends to surround the tumor (white arrow in Fig. 2(c)). Figure 2(d) shows that the density and curvature of collagen fibers far away from the tumor region are further increased relative to those near tumor transition region and collagen orientation is not related to the tumor (blue arrow in Fig. 2(c)). In the collagen fibers far away from the tumor and the normal position (white and blue arrows in Fig. 2), the morphology and density change significantly. The results showed that MPM is an excellent tool for monitoring the changes of collagen fibers from tumor boundary to normal tissue without any exogenous contrast agent.
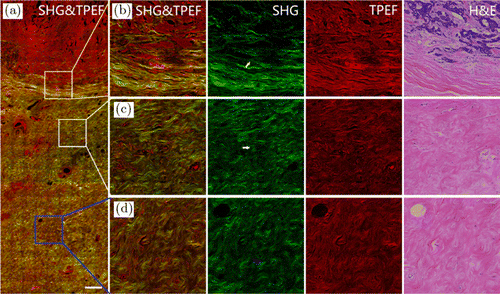
Fig. 2. MPM images and the corresponding H&E-stained image of breast tissue sections from tumor boundary to normal tissue. (a) Large scale MPM image of breast tissue sections from tumor to normal tissue. (b) Enlarged images to show tumor boundary. (c) Enlarged images to show near tumor transition region. (d) Enlarged images to show normal tissue. Scale bar: 100μm.
3.2. Quantitative analysis of the variation trend of collagen fibers from tumor to normal tissue
MPM images from tumor boundary to normal tissue were stitched together to quantitatively analyze the change trend of collagen. Figure 3 shows the large-scale TPEF and SHG superimposed images of four patients. Through TPEF and SHG overlay images, we can easily determine the tumor boundary based on the location of tumor cells, so as to follow-up analysis of the morphological characteristics of collagen fibers at different distances from the tumor boundary.
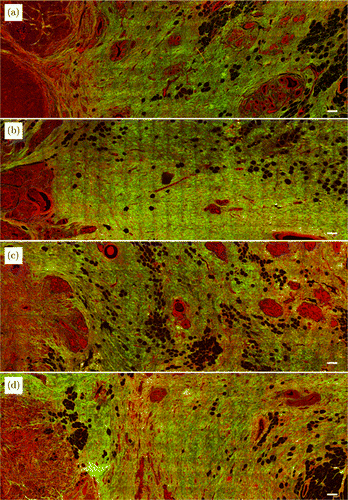
Fig. 3. MPM images of breast tissue sections from tumor border to normal tissue in four cases. Scale bar: 200μm.
The large-scale SHG single-channel images from tumor to normal tissue were spliced to quantitatively analyze the variation trend of collagen fibers. As shown in Fig. 4(a), three concentric circles centered around the tumor center were drawn to calculate the distance and mark the distance relative to the tumor boundary as 0mm (red line), 2mm (orange line) and 4mm (blue line). Then, we selected four region-of-interest (ROI) patches in each region of tumor boundary (next to tumor cells), near tumor transition region (∼2mm away from the tumor boundary) and normal tissue (≥4mm away from the tumor boundary) for collagen fiber morphological feature extraction, as shown in Fig. 4(b). The size of each ROI patch was 512 pixels×512 pixels (283.4um×283.4um). Finally, we selected a total of 480 ROI patches that meet the location requirements in 40 cases of large-scale SHG images. There were 160 ROI patches for each type of tumor boundary, near tumor transition region and the normal tissue. Before performing feature extraction, we first binarized each ROI patch using MATLAB R2018b. For feature extraction, all images were subtracted from the background and a mask was made to distinguish the background pixels and collagen fibers. For each ROI patch, a specific threshold was selected to best distinguish the pixels of collagen fibers from the background pixels, as shown in Fig. 4(c).
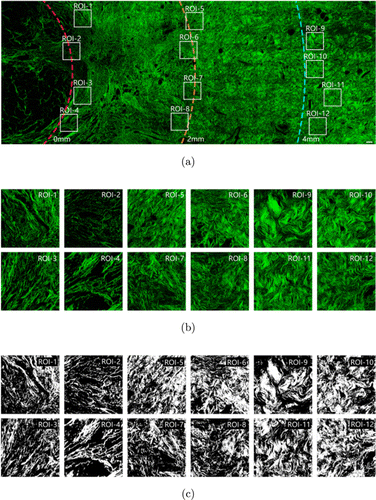
Fig. 4. Extraction of collagen microscopic features from tumor boundary to normal tissue. (a) SHG image from tumor to normal tissue. (b) Enlarged collagen fibers in the ROI patches of tumor boundary, near tumor transition region and normal tissue area. (c) Threshold processing ROI patches into binary images. Scale bar: 100μm.
Eight morphological features were selected to perform quantitative analysis of collagen morphology in these three regions. These eight morphological features were collagen proportionate area, mean of collagen fiber number, mean of collagen fiber length, mean of collagen fiber width, mean of collagen fiber straightness, mean of collagen fiber cross-link density, mean of collagen fiber cross-link space and mean of collagen fiber orientation. These morphological features were extracted from each ROI patch using MATLAB R2018b. For morphological features extraction, the collagen pixels of SHG image were segmented by Gaussian mixture model method.23 The binary collagen mask image was then processed using a fiber network extraction algorithm24 to trace each collagen fiber in the image and to identify cross-link points, which are defined as connecting points between two or more fibers. Moreover, we quantified an orientation index to reflect the collagen alignment based on Fourier transform spectra.25 The definitions and extraction methods of the eight morphological features of collagen fibers are explained in great detail in our previous paper.26
Forty breast cancer patients participated in the statistical analysis. As shown in Fig. 4, four ROI patches were randomly selected for each patient tumor boundary, near tumor transition region and normal tissue. Each region had 160 ROI patches for feature extraction and statistical analysis. The statistical analysis was performed using the IBM SPSS Statistics 25. Statistical analysis showed that the extracted values of collagen fibers in each region did not belong to a normal distribution, so we chose a nonparametric test method. First, we verified that eight features were significantly different between randomly selected ROI in the same region using the independent samples of Kruskal–Wallis test of the nonparametric test method. The results showed no differences in the eight morphological features of the same region and then we merged the 160 ROIs into one region for statistical analysis. We calculated differences between the three regions in each morphological feature using an independent-samples nonparametric test. The average and standard deviation of each set of feature extraction data were shown in Fig. 5. As can be seen from Fig. 5, the eight morphological feature of normal tissue collagen fibers are significantly different from the collagen fibers at tumor boundary and the collagen fibers in the near tumor transition region (P<0.01). From Figs. 5(a) and 5(b), we can see that the collagen proportionate area and the mean of collagen fiber number increased during the transition from tumor boundary to normal tissue, which is consistent with what we see in Fig. 4. It can be seen from Fig. 5(e) that the mean of collagen fiber straightness decreased during the transition from tumor boundary to normal tissue, that is, collagen became more curved, which is consistent with what we see in Fig. 5. It can be seen from Figs. 4(c) and 4(d) that the mean length and width of collagen fibers in tumor boundary and transition region did not change significantly but the mean length and width of collagen in normal tissue was significantly larger than that in the other two regions. It can be seen from Fig. 5(g) that the mean of collagen fiber cross-link space in the transition region is smaller than that in the other two regions. Figures 5(f) and 5(h) show that there is no significant difference in the mean of collagen fiber cross-link density and mean of collagen fiber orientation in the three regions. The results show that from normal tissues to tumors, the morphological features of collagen fibers are different, and there may be a specific trend of change. Therefore, in the continuous imaging from the tumor to the normal area, we can quantitatively analyze the changes in collagen content, which may find a new way for us to explore the relationship between tumor and collagen fibers in the TME. There is an opportunity to find the boundary between tumor and normal tissue. This indicates that this technique may provide a new basis for determining the best negative margin width for breast-conserving surgery.
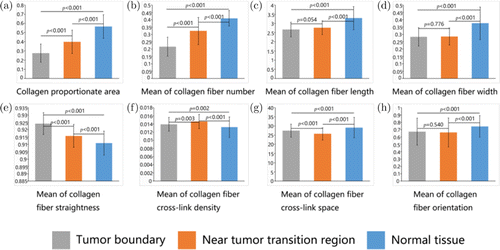
Fig. 5. Quantification of collagen feature extraction in regions of interest. A total of eight collagen features were extracted from multiphoton images. (a) Collagen proportionate area. (b) Mean of collagen fiber number. (c) Mean of collagen fiber length. (d) Mean of collagen fiber width. (e) Mean of collagen fiber straightness. (f) Mean of collagen fiber cross-link density. (g) Mean of collagen fiber cross-link space. (h) Mean of collagen fiber orientation.
Principal component analysis was applied to further analyze and visualize the change trend of eight collagen features in the three regions by utilizing OriginPro 2021. The scatter plot of the first two principal components (PCs) of the eight collagen features of 480 ROIs in the three regions is shown in Fig. 6. It can be seen from Fig. 6 that the three regions have obvious clustering effect, especially between Region 1 (Tumor boundary) and Region 3 (Normal tissue). Using a factor loadings analysis (Table 1), PC1 retained about 52.9% of data variation and differentiated the ROI region according to the contents of mean of collagen fiber length, mean of collagen fiber width, collagen proportionate area, mean of collagen fiber cross-link space and mean of collagen fiber number. Similarly, PC2 explained another 30% of variability in the eight collagen features and separates the ROI region based on mean of collagen fiber straightness, mean of collagen fiber number, mean of collagen fiber cross-link density and collagen proportionate area. Among all the eight collagen morphological features, mean of collagen fiber orientation contributes little to PC1 and PC2 but is the main factor of PC3.
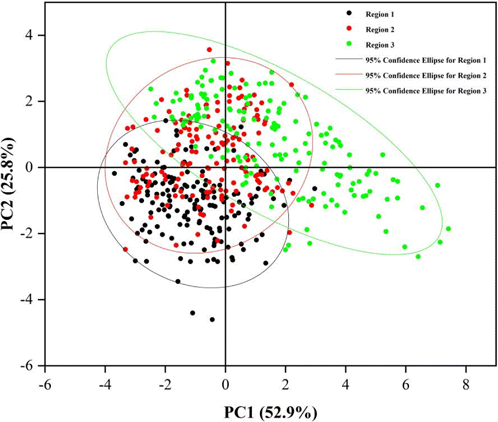
Fig. 6. Two principal component diagrams of eight morphological feature of collagen in three regions. PC, principal component; Region 1, Tumor boundary; Region 2, Near tumor transition region; Region 3, Normal tissue.
| Factor | PC1 | PC2 | PC3 |
|---|---|---|---|
| Collagen proportionate area | 0.44 | 0.26 | −0.10 |
| Mean of collagen fiber number | 0.31 | 0.48 | −0.13 |
| Mean of collagen fiber length | 0.47 | −0.01 | −0.10 |
| Mean of collagen fiber width | 0.47 | −0.10 | −0.01 |
| Mean of collagen fiber straightness | −0.06 | −0.62 | −0.07 |
| Mean of collagen fiber cross-link density | −0.30 | 0.44 | −0.13 |
| Mean of collagen fiber cross-link space | 0.41 | −0.32 | 0.00 |
| Mean of collagen fiber orientation | 0.09 | 0.11 | 0.97 |
| Eigenvalue | 4.23 | 2.06 | 0.98 |
| Explained variace | 52.88% | 25.80% | 12.31% |
4. Discussion
As an emerging imaging technology, MPM technology has shown potential in label-free pathological diagnosis. Overlay of TPEF and SHG dual-channel side imaging allows us to observe more biological tissue information. SHG can be used to image collagen fibers with high specificity. TPEF imaging reveals a unique pattern and intensity distribution of fluorescence that can represent cell morphology with high resolution. In this study, collagen fiber is the main research object. MPM images can clearly show its morphological details in the TME. The occurrence and development of tumors is an extremely complex process. Studies have shown that the complexity of tumors has a complex connection with the TME, and not only depends on the inherent feature of tumor cells.27
As one of the main components of the TME, collagen has a great relationship with tumor cells. It is generally believed that collagen fibers are a physical barrier that can prevent tumor infiltration and metastasis; studies have also shown that collagen fibers can change the adhesion of tumor cells through their own degradation and remodeling and guide the movement of tumor cells to promote tumor metastasis.28,29,30 In addition, studies have shown that collagen markers in the TME are an independent indicator of lymph node metastasis in early gastric cancer. They proposed a predictive model based on collagen markers, which is helpful for the treatment choices of patients with early gastric cancer.31 The TME is also a key factor in each stage of breast cancer development. Combined with computer assistance, quantitative tumor-associated collagen markers are independent prognostic indicators that can be used to predict individual disease-free survival.26
In breast-conserving surgery, we need to maintain aesthetics as much as possible when removing all tumors to reduce the recurrence rate. Correct selection of the optimal negative margin width can significantly reduce the recurrence rate of ipsilateral breast tumors to minimize unnecessary surgery. The definition of optimal surgical margins remains controversial. In 2016, the Society for Oncology (SSO), the American Society for Radiation Oncology (ASTRO) and the American Society for Clinical Oncology (ASCO) published consensus guidelines on breast cancer resection margin based on the results of meta-analysis of clinical evidence. The guide suggested that the negative width of ductal carcinoma was in situ>2mm.32 Subsequently, SSO-ASTRO issued consensus guidelines for breast-conserving surgery for stage I and II invasive breast cancer and proposed to use ‘no ink on tumor’ as the safe surgical margin standard for invasive cancer. At the 2017 San Antonio Symposium on Breast Cancer, Shah et al. published the results of meta-analysis that included more studies and adopted more stringent grouping criteria and evaluation criteria. It is suggested that ‘no ink on tumor’ is not the best surgical margin selection strategy, and surgical margin width 2 mm is associated with lower risk of ipsilateral breast cancer recurrence.33 Therefore, a larger-scale study of collagen fibers is necessary.
In the traditional H&E staining, the main concern is tumor cells. However, collagen fibers, as an important component of TME, also deserve attention. Many researchers have studied the collagen fibers in the front of tumor invasion in detail but few have examined the changes of collagen fibers on a larger scale. Based on MPM, we investigated the variation trend of collagen fibers in breast cancer from tumor margin to normal tissue. MPM imaging technology has obvious advantages in the display of collagen fibers. SHG images can visually display collagen fibers. By MATLAB automatic collagen feature extraction, eight morphological features were found to be significantly different. This large-scale quantification of collagen fiber feature allows us to see the variation trend of collagen fibers from tumor margins to normal tissues, which may provide surgeons and pathologists with new diagnostic perspectives.
5. Conclusion
In this work, MPM was applied to label-free imaging of collagen fibers in different regions of TME in early invasive breast cancer. By exploring collagen fibers at a larger scale, we found that the morphology and content of collagen fibers changed significantly during the transition from tumor boundary to normal tissue. The difference in quantitative morphological feature may provide us with a new perspective to study the development of tumors and collagen fibers. These changes have important reference and significance for understanding TME in tumor invasion and determining the optimal resection range of breast conserving surgery.
Conflicts of Interest
The authors report no relevant financial conflicts of interest.
Acknowledgments
This work was supported by the National Natural Science Foundation of China (Grant Nos. 82171991 and 81700576), Natural Science Foundation of Fujian Province (Nos. 2020J01154, 2020J011008, 2019J01269 and 2020J01839), Joint Funds for the Innovation of Science and Technology of Fujian Province (2017Y9038 and 2019Y9101), and the special Funds of the Central Government Guiding Local Science and Technology Development (No. 2020L3008). Yulan Liu and Shunwu Xu contributed equally to this work.

