Synchronous measurements of prefrontal activity and pulse rate variability during online video game playing with functional near-infrared spectroscopy
Abstract
Interactions between the central nervous system (CNS) and autonomic nervous system (ANS) play a crucial role in modulating perception, cognition, and emotion production. Previous studies on CNS–ANS interactions, or heart–brain coupling, have often used heart rate variability (HRV) metrics derived from electrocardiography (ECG) recordings as empirical measurements of sympathetic and parasympathetic activities. Functional near-infrared spectroscopy (fNIRS) is a functional brain imaging modality that is increasingly used in brain and cognition studies. The fNIRS signals contain frequency bands representing both neural activity oscillations and heartbeat rhythms. Therefore, fNIRS data acquired in neuroimaging studies can potentially provide a single-modality approach to measure task-induced responses in the brain and ANS synchronously, allowing analysis of CNS–ANS interactions. In this proof-of-concept study, fNIRS was used to record hemodynamic changes from the foreheads of 20 university students as they each played a round of multiplayer online battle arena (MOBA) game. From the fNIRS recordings, neural and heartbeat frequency bands were extracted to assess prefrontal activities and short-term pulse rate variability (PRV), an approximation for short-term HRV, respectively. Under the experimental conditions used, fNIRS-derived PRV metrics showed good correlations with ECG-derived HRV golden standards, in terms of absolute measurements and video game playing (VGP)-related changes. It was also observed that, similar to previous studies on physical activity and exercise, the PRV metrics closely related to parasympathetic activities recovered slower than the PRV indicators of sympathetic activities after VGP. It is concluded that it is feasible to use fNIRS to monitor concurrent brain and ANS activations during online VGP, facilitating the understanding of VGP-related heart–brain coupling.
1. Introduction
Autonomic nervous system (ANS) and central nervous system (CNS) are linked anatomically and functionally.1,2 The neurovisceral integration model proposed that the two nervous systems form a series of feedback loops that include both central and peripheral inputs and outputs.3 The CNS controls cardiac rhythm by modulating vagal functions.4 The information on cardiac rhythm is fed back to the cerebral cortices via ascending pathways, affecting cortical activities.5,6 The dynamic interactions between the CNS and ANS modulate perception, cognition, and emotional production.7,8 Recently, it has been proposed that spontaneous fluctuations of ANS/arousal activity may underpin the spatiotemporal organization of resting state functional connectivity derived from infra-slow hemodynamic oscillations measured with neuroimaging techniques.9 Heart rate variability (HRV) is the most frequently used readout from the heart, with which heart–brain coupling has been studied in health and disease.4,10,11 HRV measures variations in the time intervals between adjacent heartbeats, and is thought to reflect the balance between sympathetic and parasympathetic activities.12 HRV has also been widely used to assess cognitive status and brain health,13,14 whether as an indicator of mental stress and cognitive load,15,16 or an early biomarker of cognitive impairment,17 or an auxiliary diagnostic tool for mental diseases including depression and dementia.17,18,19,20
Most previous studies on heart–brain coupling have utilized electrocardiography (ECG) to measure HRV. This involves extracting the time intervals between adjacent R peaks and using them to calculate various time-domain, frequency-domain, and nonlinear HRV metrics.21 An alternative approach is to use photoplethysmography (PPG) on the fingertips and ear lobes,22,23 or functional near-infrared spectroscopy (fNIRS) on the forehead, to measure pulse rate variability (PRV).24,25 PRV is considered to be an approximation or substitute for HRV.26 fNIRS is a functional brain imaging modality that measures regional hemodynamic/oxygenation changes in the brain and extra-cranial tissues,27 and has been increasingly used in cognitive neuroscience research due to its convenience of use, relatively high temporal resolution, and high ecological validity.28 Fluctuations of the fNIRS signals recorded on the head not only reflect ongoing neural activities but also include contributions from spontaneous physiological variability, such as heartbeat, respiration, and Mayer waves.29 Although PPG/fNIRS measurements of heartbeat are known to be susceptible to errors introduced by lower-than-ECG sampling rates and spontaneous blood pressure/vascular tone fluctuations,30,31 PRV metrics derived in young, healthy subjects under resting or relaxed conditions appear to correlate well with the corresponding HRV metrics derived from ECG.23,32 Additionally, Hakimi et al. reported that during a Montreal imaging stress task, the heart rate (HR) changes measured with fNIRS had a high degree of agreement with those recorded by ECG.33
In previous neuroimaging studies, the contributions of systematic physiological fluctuations to the raw fNIRS signals, such as those originated from heartbeat, are treated as nuisance noises, and usually filtered or regressed out during data analysis.34 However, fNIRS is capable of measuring brain activities and PRV changes synchronously from the same data acquisition. This makes it a potentially useful single-modality tool for studying heart–brain coupling in laboratory cognitive tasks, real-world tasks, and brain stimulation paradigms that involve alterations in autonomic activities.35 In this proof-of-concept study, we took advantage of this previously often-overlooked capability of fNIRS and used it to monitor functional prefrontal activations and short-term PRV changes during online video game playing (VGP). VGP is a visuomotor task that involves cognitive control, emotional arousal, and reward processing.36,37,38 Numerous previous studies have demonstrated that VGP is associated with functional recruitment of the prefrontal cortex, as well as perturbed ANS activities.23,39,40 Moreover, most of the presumed health effects of VGP, whether beneficial or adverse, have been attributed to its acute and long-term effects on CNS and ANS functions.41,42,43 In brief, we continuously recorded fNIRS data from the forehead of university students before, during, and after they played a round of multiplayer online battle arena (MOBA) game. The VGP-related changes of dorsolateral prefrontal cortex (DLPFC) activity and short-term PRV were measured. ECG was recorded in each subject to derive HRV metrics as the golden standard to validate the fNIRS-derived PRV measurements. The results demonstrated the feasibility of using fNIRS alone to measure real-time brain activities and short-term PRV synchronously during online VGP.
2. Materials and Methods
2.1. Subjects
Twenty right-handed university students, all males with an average age of 21.1±3.021.1±3.0 years, were recruited by the campus. None of the participants had a history of cardiovascular disease or mental illness. All subjects reported having played more than 2000 matches of Honor of Kings (HOK), a popular MOBA game, in the past. The current weekly hours of HOK playing were 8.1±5.6h per week. The experimental protocol was reviewed and approved by the Human Subjects Institutional Review Board of the Innovation Academy for Precision Measurement Science and Technology, Chinese Academy of Sciences (Approval #: APMH20001). All subjects provided written informed consent.
2.2. Data collection
The participants were randomly and evenly divided into two groups. Each participant had their ECG and fNIRS recorded synchronously and uninterruptedly throughout the entire experiment. Participants were instructed to remain seated and avoid large and sudden movements. In Group 1, participants were first recorded in a 20min resting state. They were instructed to keep their eyes open, look ahead at a turned-off computer screen, relax, and not think or do anything in particular. Participants were reminded of the time that had elapsed at the midpoint and end of this period. After a short rest period (i.e., 2–3min), participants played a round of HOK game in ranked match mode until the game was over. In Group 2, the recording was performed in a reversed order. The participants were first recorded when they played the game. After a short-rest period, they were recorded in a 20mi post-game period, during which they received the same instructions as those in the first group did in the pre-game session.
The ECG data were collected using a microECG recorder (Healinink-R211A, HeaLink, Ltd., Bengbu, China) at a sampling rate of 400Hz. The fNIRS data were collected using a desktop system (NIRScout, NIRx Medical Technologies, LLC, Los Angeles, CA) at a sampling rate of 31.25Hz. The system used one laser source that transmitted wavelengths at 780 and 830nm, and four detectors were evenly distributed around the transmitter. The distance between the transmitter and detector was three centimeters. The locations of the laser source, detectors, and optical channels (Fig. 1) were digitized using a three-dimensional magnetic space digitizer (FASTRAK, Polhemus Inc., Colchester, VT). A probabilistic registration method was used to estimate the exact coordinates of each fNIRS channel in the Montreal Neurological Institute (MNI) space.44 The probabilities of the fNIRS channels being positioned in the left DPLFC ranged from 0.61 to 1.00, with an average of 0.84±0.13 across all subjects.
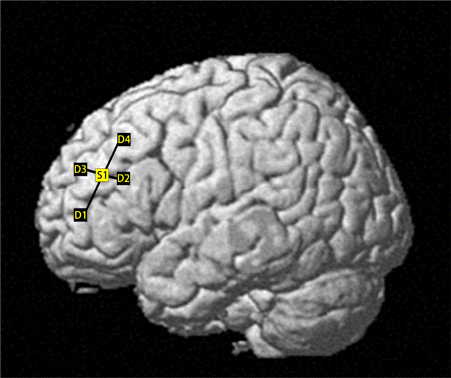
Fig. 1. The fNIRS channels overlaid on a reconstructed brain surface. S1: light source; D1–D4: Detectors 1–4.
2.3. Game
HOK is a popular MOBA game in which 10 online players are summoned and divided into two ad hoc teams of five. Each player controls a virtual character, also known as Hero, to fight against the Heroes controlled by the opposing team in a fictional game arena. The objective of the game is to destroy the master crystal of the opposing team while protecting one’s own. The game ends when one team’s master crystal is destroyed or when a team surrenders voluntarily. A typical HOK game lasts for 10–20min. For more information on HOK, visit https://pvp.qq.com.
2.4. Data preprocessing
The ECG signals were first filtered using a notch filter to remove power-line interference at 50Hz, followed by identification of the R-peaks with the Automatic Multiscale-based Peak Detection (AMPD) algorithm.45 The raw light intensity data from the fNIRS recordings were converted into oxygenated hemoglobin (HbO) and deoxygenated hemoglobin (Hb) levels using the modified Beer–Lambert law and detrended with the wavelet minimum description length (MDL) method.46 Subsequently, the hmrMotionArtifact method was used to identify and locate the data segments with apparent motion artifacts,47 which were replaced manually with estimations calculated with the cubic spline interpolation method.48 For each participant, the HbO/Hb time series acquired from the entire experiment were Fourier transformed to determine the characteristic frequency range of the heartbeat by fitting the spectral segment in the frequency range of 0.5–2.5Hz to a polynomial function (Fig. 2(b)). The HbO/Hb time series were then bandpass filtered using the frequency range determined in the previous step to extract the heartbeat-related signal oscillations. The HbO/Hb time series were also bandpass filtered between 0.01 and 0.1Hz to extract the signal oscillations related to neural activities.27,49,50 The neural activity-related time series in the gameplay period was normalized to the average measurements in a 30s period right before the game onset, and those in the pre-/post-game periods to the average measurement in the first 30s of the clipped time series.
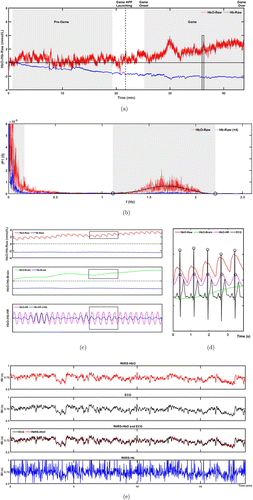
Fig. 2. Workflow of fNIRS data preprocessing. (a) The raw HbO and Hb time series normalized to the first 30s of the clipped pre-game time series from a subject in Group 1. The grey shades indicate the time windows, the fNIRS/ECG data in which were clipped and used to calculate PRV/HRV. Between Game APP Launching (dashed line) and Game Onset (starting active gameplay in the battling arena) is the loading/preparation phase of the game. (b) Frequency spectra of the HbO and Hb time series in (a). The characteristic HR frequency range of HbO in this subject is indicated by the grey shade. Open circles: The estimated cut-off frequencies of the heartbeat frequency band. (c) Magnified raw and bandpass filtered HbO/Hb time series in the time window indicated by the rectangle in the Game period in (a). HbO-/Hb-Brain: HbO/Hb oscillation in the frequency band representing neural activity (0.01–0.1Hz); HbO-/Hb-HR: HbO/Hb oscillation in the subject-specific characteristic HR frequency band (1.1–2.2Hz for this subject). (d) Superimposition of HbO oscillations in different frequency bands and ECG signals in the time window indicated by the rectangle in (c). The open circles indicate the positions of the R peaks in ECG and the contraction peaks of the fNIRS-derived pulsatile waveform, which were identified automatically and used to calculate IBI. (e) The IBI measured with ECG and fNIRS during the gameplay period are depicted in panel a.
2.5. Data analysis method
The duration of gameplay (i.e., from game onset to game over, as shown in Fig. 2(a)) varied among the participants. The average durations of gameplay in the two groups were 897.6±188.5s and 950.4±187.4s, respectively. The inter-group difference was not statistically significant, as revealed by independent samples t-test (p=0.247). Because the length of data recording may potentially affect the results of HRV/PRV calculation,21 the ECG and fNIRS time series recorded for each subject in the pre- or post-game periods were clipped to have exactly the same length as that of one’s own gameplay, centering at the midpoint of the 20min recording period. For each subject, statistical comparisons were made between the HRV, PRV, and normalized HbO/Hb levels in the DLPFC averaged across the gameplay period and the clipped pre- or post-game period. Automatically estimated inter-beat intervals (IBI) were used to calculate the HRV and PRV metrics with the free-for-download version of the Kubios software.51 Repeated measures analysis of variance (RM-ANOVA) was used to assess the differences among the PRV measurements from different fNIRS channels. Given that no significant channel effect was observed, the PRV metrics obtained from the four channels were averaged to represent the subject-level measurements. The reported brain fNIRS responses were also the averaged results across different channels.
The IBI derived from the fNIRS signals was correlated to that derived from the ECG recording. The averaged correlation coefficients between the HbO- and ECG-derived IBI were 0.89±0.03 during gameplay and 0.91±0.03 in the pre-/post-game periods. In comparison, the mean correlation coefficients between Hb- and ECG-derived IBI were 0.15±0.11 during gameplay and 0.15±0.19 in the pre-/post-game periods, which were significantly lower than the mean correlation coefficients between HbO- and ECG-derived IBI (paired t-tests, p<0.001). As a result, we subsequently used only the fNIRS-derived HbO data to calculate PRV. A total of eight commonly used HRV/PRV metrics, five in the time domain, and three in the frequency domain, were calculated, including mean inter-beat interval (mIBI), sympathetic nervous system index (SNS), parasympathetic nervous system index (PNS), root mean square differences between successive inter-beat intervals (RMSSD), standard deviation of normal-to-normal inter-beat intervals (SDNN), fast Fourier transform low-frequency (LF) power, fast Fourier transform high-frequency (HF) power, and the ratio between LF and HF (LF/HF). In Kubios software, PNS is computed based on mIBI, RMSSD, and Poincaré plot index SD1 in normalized units, and SNS is computed based on mean HR, stress index, and Poincaré plot index SD2 in normalized units.51 SD1 and SD2 reflect a weighted combination of LF and HF power of HRV.52,53 SD1 is essentially equivalent to RMSSD and quantifies mainly short-term HRV.54 SD2 correlates to SDNN and describes both short-term and long-term HRV.53
Statistical comparisons were conducted using the SPSS software. Normality and homogeneity of variance were tested using the Kolmogorov–Smirnov tests. The data that did not conform to a normal distribution were transformed using the normal score method before further statistical analyses.55 RM-ANOVA was used to analyze the VGP-related change of normalized HbO/Hb (ΔHbO/ΔHb) in the DLPFC, fNIRS-derived PRV metrics, and ECG-derived HRV metrics, with time window (i.e., gameplay versus pre-/post-game) as the within-subjects factor and group as the between-subjects factor. Post hoc paired t-tests with Bonferroni correction (n=2) were used for within-group gameplay versus pre-/post-game comparisons. Statistical comparison of ΔPRV and ΔHRV was conducted using RM-ANOVA, with measurement modality as the within-subjects factor and group as the between-subjects factor. Linear regression and paired t-tests were carried out on the pooled data from the two groups to evaluate the consistency between PRV and HRV measured in the pre-/post-game periods and during gameplay. Bland–Altman plots were used to display the differences between the fNIRS-derived PRV metrics and ECG-derived HRV metrics measured during gameplay.25 In all statistical analyses, a corrected p less than 0.05 was considered to be statistically significant.
3. Results
Figure 2 illustrates the workflow of fNIRS data preprocessing and analysis. The standard deviation (SD) of the raw fNIRS time series did not show any statistically significant difference between the game and pre-/post-game periods (p>0.05, paired t-tests). For each participant, the raw fNIRS time series recorded throughout the entire experiment was initially Fourier transformed to identify the individual-specific characteristic frequency range of the heartbeat (Fig. 2(b)). The time series were then bandpass filtered within this frequency range and 0.01–0.1Hz to extract the frequency bands representing the heartbeat rhythms and neural oscillations, respectively (Fig. 2(c)). The characteristic frequency range of heartbeat could not be reliably identified from the Hb power spectrum (Fig. 2(b)). Thus, the frequency range identified from the HbO time series from the same subject was used to extract the heartbeat-related Hb signal oscillations shown in Fig. 2(c). The IBI obtained from the heartbeat-related signal oscillations were used to calculate PRV metrics which were compared to the HRV metrics calculated from the ECG recording (Fig. 2(d)). Figure 2(e) displays the correlation between the fNIRS-derived IBI and ECG-derived IBI (i.e., RR intervals) during gameplay.
Figure 3 illustrates the (a) prefrontal ΔHbO/ΔHb and (b) selected PRV metrics measured during VGP and in the pre-/post-game periods. RM-ANOVA revealed a statistically significant main effect of time window for prefrontal ΔHbO/ΔHb, mIBI, HF, PNS, and SNS. However, none of the measurements showed a statistically significant main effect of group or time window×group interaction. Post hoc comparisons showed that both groups had a significant increase in prefrontal ΔHbO and a significant decrease in prefrontal ΔHb during gameplay. In Group 1, mIBI, HF, and PNS significantly decreased, while SNS significantly increased during gameplay compared to the pre-game period levels. In Group 2, mIBI significantly increased, and SNS significantly decreased in the post-game period compared to the corresponding metrics measured during gameplay.
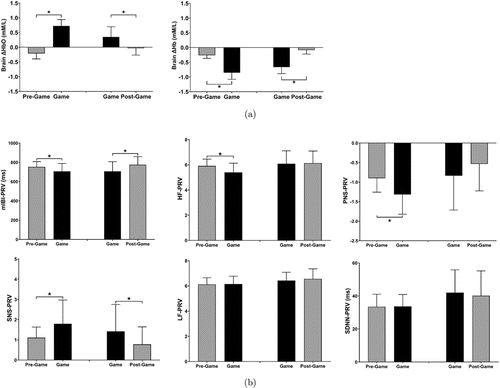
Fig. 3. Relative changes of prefrontal ΔHbO/ΔHb levels during gameplay (a). fNIRS-derived PRV metrics measured during gameplay and in the pre-/post-game periods (b). *: p<0.05, paired t-test with Bonferroni correction.
Figure 4 plots the selected HRV measurements during VGP and in the pre-/post-game periods. RM-ANOVA revealed a significant main effect of time window for mIBI, HF, PNS, and SNS. None of the measurements showed a significant main effect of group or time window×group interaction. In Group 1, mIBI, HF, and PNS significantly decreased, while SNS significantly increased during gameplay compared to the pre-game period levels. In Group 2, mIBI significantly increased, and SNS significantly decreased in the post-game period compared to the corresponding metrics measured during gameplay.
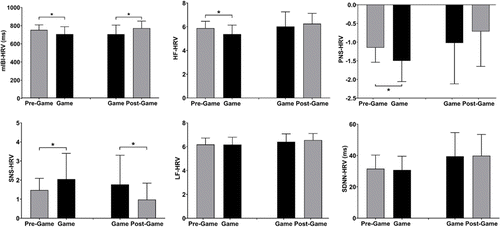
Fig. 4. ECG-derived HRV metrics measured during gameplay and in the pre-/post-game periods. *: p<0.05, paired t-test with Bonferroni correction.
Regardless of the measurement period, the PRV metrics measured with fNIRS showed a linear relationship with the corresponding HRV metrics measured with ECG (R2≥0.58, p<0.001). With no exceptions, the linear slope was statistically significant (p<0.001), and the intercept was not significantly deviated from zero (p>0.05). The linear slope ranged from 0.71 to 1.08, with the lowest values observed for PNS (pre-/post-game: 0.710; gameplay: 0.809), SNS (pre-/post-game: 0.727; gameplay: 0.856), and SDNN (pre-/post-game: 0.892; gameplay: 0.884). Analysis of pooled data from the two groups using paired t-tests indicated that the PRV measurements of mIBI, HF, LF, and RMSSD did not differ significantly from their corresponding HRV measurements. However, SNS and SDNN measured with fNIRS were significantly higher (p<0.05) than those measured with ECG, while PNS was significantly lower (p<0.05). This trend was observed both during the pre-/post-game periods and during gameplay. Figure 5 displays the Bland–Altman plots that assess the consistency between the fNIRS-derived PRV metrics and EEG-derived HRV metrics measured during gameplay. The differences between the corresponding PRV and HRV metrics were all within the range of ±1.96 standard deviations from the mean.
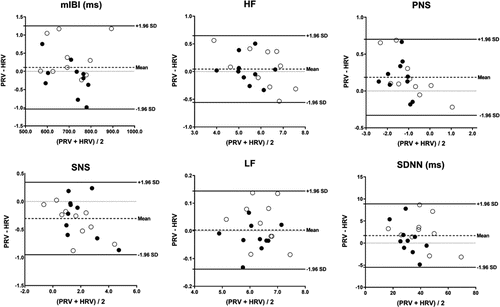
Fig. 5. Bland–Altman plots of selected PRV and HRV metrics measured during gameplay. Solid and open circles: Data from each subject in Groups 1 and 2, respectively; Dashed line: Averaged difference between PRV and HRV across all subjects; Solid lines: Upper and lower bounds of 95% confidence intervals (i.e., mean±1.96×standard deviation (SD)); Dotted line: Level zero.
Figure 6 illustrates the correlation between gameplay-induced ΔPRV and ΔHRV using pooled data from the two groups. The linear slope was statistically significant (p<0.001) for all metrics plotted, while the intercept was not (p>0.05). Analysis of variance (ANOVA) comparing ΔPRV and ΔHRV in the two groups did not reveal any statistically significant main effects of measurement modality, group, or measurement modality×group interaction.
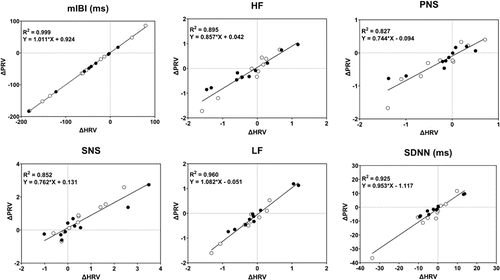
Fig. 6. Correlation between gameplay-related ΔPRV and ΔHRV. Solid and open circles: Data from the subjects in Group 1 (game minus pre-game) and Group 2 (game minus post-game), respectively. Solid line: Least-square linear fit to the pooled data from the two groups.
4. Discussion
There has been a growing interest in studying heart–brain coupling and/or interactions between the CNS and ANS.5 The ANS activity, which can be assessed through HRV measurements, has been found to impact emotions and cognitive performance,7,8 and may have potential diagnostic and prognostic applications for neurological and psychiatric disorders.2 Previous studies on CNS–ANS interactions have typically recorded brain responses using EEG or fMRI,6,56 while measuring heartbeat signals separately using ECG or PPG devices.4,57 fNIRS has become increasingly popular in recent years, particularly for naturalistic and real-world tasks, due to its high-temporal resolution, ecological validity, and applicability to hyperscanning.28 Previous studies have attempted to use the heartbeat frequency band of the fNIRS signals recorded in neuroimaging studies to measure PRV.24,33,58 It was demonstrated that, compared to those measured with wearable PPG devices at the fingertip, the PRV metrics measured with fNIRS on the forehead provide a better characterization of the sympathetic and parasympathetic activities associated with respiratory challenges and ambient temperature changes, especially regarding the short-term variability.58 Additionally, recent research has demonstrated that different frequency bands of fNIRS signals can be used to measure prefrontal activity and PRV synchronously at resting state.24 This study builds upon previous research and applies a single-modality approach to measure prefrontal activations and PRV changes synchronously during online VGP, relative to those recorded in the pre- and post-game periods. The PRV indicators of ANS activity derived from the fNIRS measurements correlated significantly with the corresponding HRV indicators measured with ECG, in terms of both the absolute numbers and VGP-related changes. This study established the feasibility of using fNIRS, alone, to study the CNS–ANS interactions in real-world tasks.
Neuroimaging techniques, including fNIRS, have been utilized to monitor brain activity associated with VGP.59,60,61 Consistent with previous studies,62,63 this study found that online VGP was associated with a significant increase in ΔHbO and a significant decrease in ΔHb in the DLPFC (Fig. 3(a)). VGP has also been shown to affect alertness, emotional arousal, and stress,64 which are likely to be associated with perturbations in ANS activity. For example, it has been reported that VGP is accompanied with increased sympathetic activity and decreased parasympathetic activity, which are represented by significantly increased LF and significantly decreased HF, respectively.23,65 Compared to healthy controls, individuals diagnosed with Internet game addiction (IGD) were reported to have greater HF reductions during gameplay, especially during the game phases requiring high attention, and gameplay-induced HF reduction in these individuals correlated significantly with IGD scores.40,66 Consistent with these previous findings, we found in this study that the PRV/HRV indicators of sympathetic activity, including HR and SNS, showed significant increases during online VGP, regardless of the modality used for heartbeat recording and group (Figs. 3(b) and 4).
Changes of the PRV/HRV indicators of parasympathetic activity (i.e., PNS and HF), however, differed between the two groups. Significant decreases in PNS and HF were observed during gameplay compared to the pre-game period (Figs. 3(b) and 4). However, these metrics did not change significantly up to 20min after the gameplay (Figs. 3(b) and 4). This result is consistent with the previous report showing an enduring decrease in HF up to 30min after VGP, which was attributed to parasympathetic withdrawal-associated arousal and linked to an enhanced cognitive state.67 Previous studies have demonstrated that, despite that physical activities and/or exercises induce concurrent and opposite changes of sympathetic and parasympathetic activities, the recovery after the tasks towards the baseline often appears to slow down for the parasympathetic activity than for the sympathetic activity.68,69,70 For example, HF remained significantly suppressed up to 60min after performing a virtual-reality dancing game.68 HF did not recover to the pre-exercise levels 140min after sprint-interval exercises of varying intensity.71 Vagal reactivation underlies the recovery of HR after physical activities/exercises.72,73 It has been proposed that increased sympathetic activity and metabolic reflex stimulation during physical activity/exercise may increase acetylcholine release and the pressure reflex set point closely related to vagal reactivation to a higher level than at rest, delaying the recovery of the PRV/HRV metrics representing parasympathetic activity.71,74 In addition, a recent study showed that parasympathetic activities observed after cognitive tasks might be involved in the consolidation of task-related memories.75
Sleep disturbance and insomnia are known to be associated with reduced parasympathetic activity during the awake state.76,77 VGP before sleep is a well-known risk factor of sleep disturbance.78 Recent research has demonstrated that dysregulated parasympathetic activity is involved in VGP-related sleep disruption, even when individuals go to bed at their normal bedtime.79 In a population of video game players, sleep quality was found to be negatively correlated with the intensity of VGP.80 Excessive or problematic VGP is well-known to be associated with poor sleep quality and insomnia.81,82,83 Additionally, individuals diagnosed with IGD were frequently observed to have reduced parasympathetic activity during the resting state,84,85 as well as dysregulated parasympathetic activity during gameplay.40,66 Further studies are needed to determine whether VGP-induced suppression of parasympathetic activity and its delayed recovery contribute to sleep disruption and the development of IGD.
It has been shown that insufficient sampling frequency can lead to inaccurately determined R peaks in ECG recordings, reducing the validity/accuracy of certain HRV measurements.31 fNIRS records hemodynamic responses. The pulsatile waveform of the heartbeat recorded with fNIRS is much broader than the R peaks. Therefore, fNIRS-derived heartbeat intervals may be measured with an acceptable accuracy at lower sampling frequencies than that is required for HRV measurements with ECG.31 A previous study demonstrated that fNIRS-derived PRV metrics estimated with a sampling frequency as low as 18.52Hz correlated significantly with HRV metrics derived from ECG recordings at a sampling frequency of 250Hz.24 In this study, the sampling rate of fNIRS was 31.25Hz, and it should not have limited the accuracy or precision of fNIRS-based PRV measurements.
The absolute values of PNS, SNS, and SDNN calculated from the fNIRS data differed significantly from those measured with ECG. This result agreed with a previous report showing the absolute values of SDNN and SD2, but not those of RMSSD or SD1, measured with fNIRS on the forehead differed significantly from the corresponding metrics measured with ECG.24 It is widely recognized that the precision of PPG- and fNIRS-based PRV measurements, particularly those that quantify low-frequency or long-term heart rhythm variability, can be compromised by errors in peak identification.31 The amplitudes of such errors are related to the shape and width of the hemodynamic heartbeat waveform, which in turn depend on the recording location and are modulated by spontaneous physiological fluctuations other than heartbeat rhythms.22,30 Nevertheless, all fNIRS-derived PRV metrics were found to correlate significantly with the corresponding ECG-derived HRV metrics in this study. Furthermore, gameplay-related changes in PRV and HRV not only exhibited a significant linear correlation (Fig. 6), but also had no significant difference between them in terms of the absolute numbers. These findings suggest that, at least empirically, fNIRS-derived PRV metrics could serve as a valid alternative or approximation to ECG-derived HRV metrics, at least in the context of studying ANS activity perturbations related to online video game play.
The primary objective of this study is to test the feasibility of using single-modality fNIRS neuroimaging data to extract data on prefrontal activations induced by VGP and accompanying PRV changes synchronously. The detailed analysis of CNS–ANS interactions during VGP is not within the scope of this paper, and will be studied in the future. In addition to the cross-correlation approaches commonly used in fMRI studies to evaluate how the ANS activities modulate blood oxygenation level dependent (BOLD) signals in the brain,56,57 the fNIRS studies on CNS–ANS interactions may benefit from the higher temporal resolution offered by the technique to enable time-locked analysis and/or time-frequency analysis, which are currently limited only to the EEG–ECG studies of heart–brain coupling.4,5,6 More sophisticated data analysis methods/mathematical models, such as directed transfer function, corrected conditional entropy and dynamic causal model may also be applicable in the single-modality fNIRS studies on heart–brain coupling.86
5. Conclusions
This study demonstrated the feasibility of using single-modality fNIRS to synchronously record prefrontal activation and ANS activity perturbation during online VGP. The PRV metrics derived from the fNIRS data recorded on the head in neuroimaging studies can potentially be used as alternative/approximate measures of ECG-derived HRV metrics to assess task-related changes in ANS activity and heart–brain coupling.
Acknowledgment
This work was supported by a grant from the National Natural Science Foundation of China (Grant No. 21790392).
Conflicts of Interest
The authors declare that there are no conflicts of interest relevant to this article.


