Semantic segmentation of pyramidal neuron skeletons using geometric deep learning
Abstract
Neurons can be abstractly represented as skeletons due to the filament nature of neurites. With the rapid development of imaging and image analysis techniques, an increasing amount of neuron skeleton data is being produced. In some scientific studies, it is necessary to dissect the axons and dendrites, which is typically done manually and is both tedious and time-consuming. To automate this process, we have developed a method that relies solely on neuronal skeletons using Geometric Deep Learning (GDL). We demonstrate the effectiveness of this method using pyramidal neurons in mammalian brains, and the results are promising for its application in neuroscience studies.
1. Introduction
Neurons are the fundamental functional units of the brain, and their tree-like morphology is closely related to their function.1 In the mammalian brain, most neurites can be clearly categorized as dendrites or axons. Neurotransmitters are released from pre-synapses in the axons and received in the post-synapses in dendrites. With the rapid development of microscopy imaging and image analysis methods, more and more neurons are being traced and their neurite skeletons are being mapped. A large number of traced neuron skeletons are publicly available on the website NeuralMorpho.org. However, we have observed that the axons and dendrites in most of the skeletons on this website are not classified as such. This classification is essential for certain scientific studies, such as neuron activity simulation.
Over 100 years ago, S. Ramón y Cajal used Golgi staining and identified the information flow direction solely based on the neuron morphology.2,3 Using advanced Electron and Light Microscopy, synapses could be clearly identified and became the gold standard for neurite classification.4 In recent years, deep learning techniques,5 such as Convolutional Neural Networks (CNNs), can accurately reconstruct and classify neurites in 3D images of the brain.6,7,8,9,10,11,12 Genetic modification has also made it possible to label neurites and image them using Light Microscopy.13,14 However, these approaches require specialized setup and do not depend solely on the neural morphology. Building on the success of Cajal, a Nobel laureate and a pioneer of modern neuroscience,2,3 many neurons can still be classified based solely on their morphology.
Currently, most neurites are still manually classified by neuroscientists. Existing automated classification methods use manually designed features and traditional machine learning, such as Random Forest.15,16,17 For example, Celii et al. proposed the NEURD software package, which achieves accurate skeleton segmentation by performing mesh segmentation based on manually designed skeleton features, such as skeleton length, angle between projections, and differences in average width.18 However, the success of Deep Learning suggests that data-driven learned features typically outperform hand-designed features. Thanks to significant investment from industries such as robotics and autonomous driving, many Point Cloud processing technologies have been developed. Deep Neural Networks can be trained directly using Point Cloud representation, a technique known as Geometric Deep Learning (GDL), which performs much better than traditional machine learning.19,20 GDL has been successfully applied to the analysis of neuronal meshes,21,22,23,24,25 but not yet to the analysis of skeletons.
Here, we try to fill this void and explore the possibility of semantic segmentation of neuron skeletons using GDL. To the best of our knowledge, this is the first application of GDL for the analysis of neuronal skeleton morphology. This paper is a proof of concept, which is an initial validation and will be followed by more in-depth application and research.
2. Materials and Methods
2.1. Dataset
Neuromorpho.org is the largest publicly available database of digital reconstructions of neurons.26 It provides researchers with a vast collection of traced neuron skeletons that are commonly used in the study of neuron morphology, including neuron morphology retrieval and classification. This website is widely used in neuroscience research and has continuously updated and released data. By automating the classification of axons and dendrites using only neuronal skeletons, we could potentially save researchers a considerable amount of time and effort in studying neuron morphology, which would benefit various fields of neuroscience research.
While the NeuroMorpho.org website provides researchers with a vast collection of traced neuron skeletons, only a few neurons are shared with classified neurites. As a result, in many cases, we have to rely on the morphology of the skeleton to classify axons and dendrites, which may not always be possible. For example, in some types of neurons such as those found in insects and the mammalian retina, there is a mixture of dendrites and axons that cannot be classified according to skeleton morphology alone. However, there are also specific types of neurons in the mammalian brain with distinct axon and dendrite morphology, which can be classified based on skeleton morphology.
An outstanding example is the pyramidal neurons, that are commonly located in most mammalian cerebral cortex and subcortical structures (e.g., hippocampus and amygdala).27 The pyramidal neurons are named for their cone-like shape. The basic structure of the pyramidal neuron consists of axons, dendrites, and soma. The axons emanate from the cone-shaped soma, and the dendrites are one to many protrusions from the neuronal cells, which appear radial. The axon is long and the dendrite is short, and the axon is structurally much longer than the dendrite.28 Thus, axons in pyramidal neurons can be distinguished from dendrites solely by the features of skeletal morphology.
We downloaded the pyramidal neurons from neuromorpho.org in SWC format. Each SWC file contained a brief description of the data source and the semantic classes including somas, axons, trunk dendrites, branching dendrites, and others.
2.2. Data cleaning
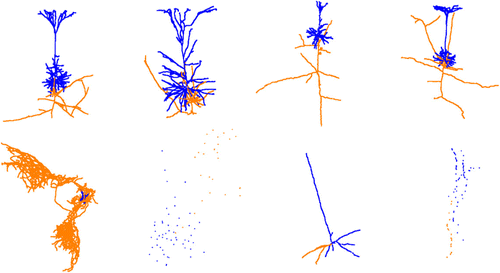
The downloaded raw data presents some challenges due to incomplete reconstruction and indistinct morphological features in some neurons (such as missing axons or dendrites). Therefore, before using the data for training, it needs to be cleaned. In the data cleaning process, we counted the number of axons and dendrites for each neuron based on the labels in the dataset and eliminated neurons without either axons or dendrites. We then visualized the point cloud using open3d29 and excluded data with inconspicuous or irregular morphological features. Figure 1 illustrates some examples of regular and irregular pyramidal neurons.

Fig. 1. The upper half shows the examples of pyramidal neurons that are preserved after data cleaning, and the lower half shows the examples of irregular pyramidal neurons that were filtered out. In the visualized neuron, the blue part represented dendrites and the orange part represented axons.
After cleaning the data set, we were left with 2075 pyramidal neurons that could be used for semantic segmentation of axons and dendrites. Initially, 21,626 pyramidal neurons were downloaded from NeuroMorpho.Org, but after screening for neurons without axons and dendrites and visualizing the Point Cloud to exclude irregular shapes, only 2075 neurons remained. In total, 16,505 axons with zero labels and 267 dendrites with zero labels were removed during the screening process, leaving 4854 neurons. After further visualization and screening, additional 2779 neurons with irregular shapes were removed, resulting in the final data set of 2075 pyramidal neurons suitable for semantic segmentation.
2.3. Data preprocessing
After cleaning the data, the remaining point clouds still needed to be processed to improve efficiency for training. Point cloud data preprocessing included two steps: Sampling and normalization. Sampling involved randomly selecting a fixed number of points from each point cloud to standardize the number of points, which is required as the input for network training. After statistical analysis of the median and mean values of all neurons, the fixed number of points was set to 4096.
Normalization of point cloud data involved centering and scaling operations. Centering involved moving the coordinates of the point cloud data so that it was centered on the origin. Scaling involved scaling the point cloud up or down to ensure the data had the same scale. These operations helped to normalize the data and make it easier for the neural network to learn.
2.4. Deep learning for point cloud analysis
Due to the rapid development and popularity of 3D sensors and computer graphics, deep learning for point cloud analysis has been an emerging area of computer vision.29 With the emergence and development of GDL, the accuracy (ACC) of classification and segmentation based only on morphological features has been improved a lot.30,31 For 3D Point Cloud processing, PointNet is a milestone that first consumes Point Cloud data directly with Neural Networks and achieves outstanding ACC.32 In this study, PointNet was applied for the semantic segmentation of neuron skeletons.
As depicted in Fig. 2, the semantic segmentation process of mammalian brain pyramidal neurons was conducted from the perspective of Point Cloud. Initially, a vast amount of raw data was downloaded from neuromorpho.org, consisting of 21,626 pyramidal neurons from various mammalian brains. After data cleaning, only 2075 pyramidal neurons that met the defined criteria were retained. The obtained pyramidal neuron skeletons were used as input for the PointNet, which was trained end-to-end for the semantic segmentation task. Subsequently, the trained network was capable of classifying the neurites of a given pyramidal neuron skeleton.

Fig. 2. Semantic segmentation of brain pyramidal neurons from the point cloud perspective.
2.4.1. Model training
In the training phase, the batch size was set to 1 to match the label information of a single neuron and the weight of the corresponding label in the neuron at the same time. The dataset consisted of 2075 neurons, which were divided into training, validation, and test sets in the ratio of 3:1:1. After experimentation, the number of fixed points in the point cloud was set to 4096 based on the point number distribution. During data processing, normalization and data augmentation operations such as panning and dithering were performed on the data. The processed point cloud data were then fed directly into PointNet. The Adam optimizer was used for training, with a total of 160 epochs and the widely-used cross-entropy loss function. The initial learning rate was set to 0.0002 and decayed 0.8 times every 10 cycles.
2.4.2. Model evaluation
The model only output the predicted label results of the points (axons or dendrites), in order to better compare the label of the predicted point with the label of the original data point (ground truth), we use the total number of consistent prediction label with the ground truth to compare with the total number of the original data volume, and finally obtained the score result of the ACC.
T_total denotes the total amount of ground truth data.
In addition, we performed a statistical analysis of the Point Average Class Accuracy (PACA).32 PACA is the average of the percentage of correctly predicted points in each class over the total number of points in that class.
2.4.3. Optimization
Loss function. Cross-entropy loss is a commonly used loss function in classification problems. It measures the difference between the predicted probabilities and the true labels. It works by penalizing the model when the predicted probability of the correct label is low. This loss function has shown to be effective in optimizing classification models and it is often used as the default choice in deep learning frameworks. In the case of the neural network used for the semantic segmentation of neuron skeletons, the cross-entropy loss performed better compared to focal loss and negative log likelihood (NLL) loss based on the evaluation metrics of ACC and PACA (Table 1).
| Loss functions | ACC | PACA |
|---|---|---|
| Focal loss | 0.8118 | 0.7713 |
| NLL loss | 0.81112 | 0.7710 |
| Cross-entropy loss | 0.8439 | 0.8015 |
Normalization. It’s worth noting that normalization of point cloud data is a common practice in deep learning for point cloud analysis. In this study, the authors performed three normalization techniques on the input point cloud data of cone neurons: None, Centering, and Centering Plus Scaling. The goal of normalization was to account for uncertainty in the absolute position of the cone neuron coordinates, which could potentially affect the performance of the model. Table 2 shows the comparison of the three normalization techniques in terms of ACC and PACA. The results indicate that the best performance was achieved through centering only, which means that scaling had minimal impact on the morphological features of the neuronal data.
| Normalization method | ACC | PACA |
|---|---|---|
| None | 0.8124 | 0.7703 |
| Centering plus scaling | 0.8371 | 0.7938 |
| Centering | 0.8439 | 0.8015 |
Model improvement. After data preprocessing, 2075 neurons were used with each neuron having 4096 fixed points. Since the dataset was not large, there was evidence of partial overfitting when training the full PointNet network. To optimize the network, some convolutional layers were removed, resulting in improved performance.
3. Results
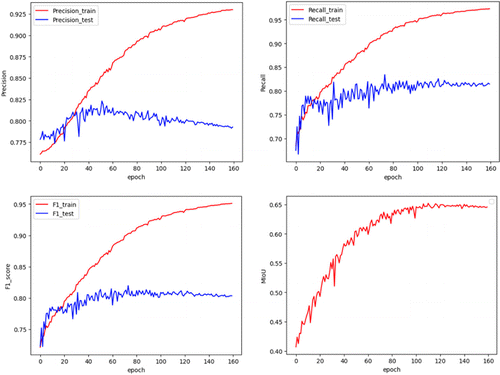
The experimental results illustrate that the PointNet network successfully underwent end-to-end training on the dataset, yielding an ACC of 0.8439 on the test set. In addition, the evaluation indicators (precision, recall, F1-score, and MIoU) in the experiment are shown in Fig. 3.

Fig. 3. Experimental evaluation indicators (precision, recall, F1-score, and MIoU).
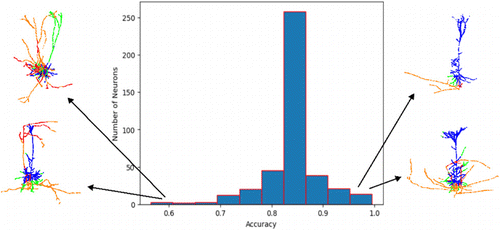
The ACC distribution on the test set showed varying levels of ACC for different neurons, with some having low ACC and others having higher ACC. To investigate the reasons for this, poorly predicted results and better pyramidal neuron point cloud data were visualized and compared to the corresponding ground truth. Figure 4 illustrates the ACC of each neuron and the number of neurons with the corresponding ACC. The larger proportion of red and green parts on the left side of the figure (indicating a low ACC) is more likely to be inaccurately predicted compared to the right side of the figure. In addition, the neurons on the left side of the figure exhibit less distinct and irregular morphological features compared to the neurons on the right side of the figure.

Fig. 4. Histogram of prediction results for all pyramidal neurons on the test set and the corresponding number of neurons. The horizontal coordinate is the percentage of data in the test set, and the vertical coordinate is the number of neurons in the test set. The left side shows examples of low-precision pyramidal neurons, and the right side shows examples of high-precision pyramidal neurons. Dendrites are shown in blue, axons in orange, axons incorrectly predicted as dendrites in red, and dendrites incorrectly predicted as axons in green.
The results of our analysis suggest that the ACC of predictions is closely linked to the standardization and clarity of the morphological features of pyramidal neurons. Neurons with more regular and distinct morphological features tended to yield better results, as compared to those with less distinct and irregular skeletons.
4. Discussion
The availability of large amounts of data from NeuroMorpho.Org, while useful, also presents challenges in terms of data quality control. As such, this study highlights the importance of data filtering and preprocessing in order to obtain a usable dataset for further analysis.
There exist several limitations of this method. One of the limitations of this study is the assumption that the neuron skeleton is complete, including both dendrites and axons. Additionally, the subjective identification and recognition of the standardized and complete morphology during data cleaning can lead to inconsistencies among different individuals. Therefore, further efforts are needed to develop more objective and reliable criteria for identifying and recognizing standardized morphology in pyramidal neurons. Furthermore, this method is only applicable to neurons with distinct axon and dendrite skeleton morphology. If the axons in a neuron type are hard to identify from the skeleton morphology along, this method could not be applied.
Despite these limitations, the successful application of GDL in semantic segmentation of pyramidal neuron skeletons represents a significant advancement in the field of neuroscience research. This automated and accurate neuron labeling method has the potential to greatly reduce the time and effort required for manual annotation, enabling more efficient and comprehensive analyses of neural networks and their functions. Furthermore, the results of this study may contribute to the development of treatments for neurological disorders by providing a more detailed understanding of neural circuits and their role in brain function.
Note that this work is just a proof of concept, and it is the first attempt to use it, so we chose the pyramidal neuron with more distinct skeleton characteristics for the experiment. We are actively looking for relevant datasets and plan to conduct such tests in future research. At the same time, we also welcome other researchers to use our method and apply it in their research.
5. Conclusions
After processing pyramidal neurons in mammalian brains, we successfully obtained a skeleton dataset for semantic segmentation. Through end-to-end training of the dataset using the PointNet network, we achieved effective classification. To the best of our knowledge, this study is the first to demonstrate semantic segmentation of neuron skeletons using GDL. The success of GDL enables automatic, efficient, and accurate neuron labeling, saving a considerable amount of time and effort in neuroscience research.
Acknowledgments
The work was supported by the Simons Foundation, the National Natural Science Foundation of China (No. NSFC61405038) and the Fujian provincial fund (No. 2020J01453).
Conflicts of Interest
The authors declare that there are no conflicts of interest relevant to this article.
References
- 1. , “Large scale similarity search across digital reconstructions of neural morphology,” Neurosci. Res. 181, 39–45 (2022). Crossref, Web of Science, Google Scholar
- 2. , 1909–1911 Histologie du système nerveux de l’homme et des vertébrés, Vol. 2 (Maloine, Paris, 1952). Google Scholar
- 3. , “From Cajal to connectome and beyond,” Annu. Rev. Neurosci. 39, 197–216 (2016). Crossref, Web of Science, Google Scholar
- 4. , “Some features of the submicroscopic morphology of synapses in frog and earthworm,” J. Cell Biol. 1(1), 47–58 (1955). Crossref, Google Scholar
- 5. , “Deep learning,” Nature 521(7553), 436–444 (2015). Crossref, Web of Science, Google Scholar
- 6. T. Macrina et al., “Petascale neural circuit reconstruction: Automated methods,” bioRxiv, doi: 2021.08.04.455162 (2021). Google Scholar
- 7. , “Weighted average ensemble-based semantic segmentation in biological electron microscopy images,” Histochem. Cell Biol. 158(5), 447–462 (2022). Crossref, Web of Science, Google Scholar
- 8. , “3D neuron microscopy image segmentation via the ray-shooting model and a DC-BLSTM network,” IEEE Trans. Med. Imag. 40(1), 26–37 (2020). Crossref, Web of Science, Google Scholar
- 9. , “Tracing in 2D to reduce the annotation effort for 3D deep delineation of linear structures,” Med. Image Anal. 60, 101590 (2020). Crossref, Web of Science, Google Scholar
- 10. , “Deep-learning-based automated neuron reconstruction from 3D microscopy images using synthetic training images,” IEEE Trans. Med. Imag. 41(5), 1031–1042 (2021). Crossref, Web of Science, Google Scholar
- 11. , “Joint segmentation and path classification of curvilinear structures,” IEEE Trans. Pattern Anal. Mach. Intell. 42(6), 1515–1521 (2019). Crossref, Web of Science, Google Scholar
- 12. , “Structure-guided segmentation for 3D neuron reconstruction,” IEEE Trans. Med. Imag. 41(4), 903–914 (2021). Crossref, Web of Science, Google Scholar
- 13. , “Fly MARCM and mouse MADM: Genetic methods of labeling and manipulating single neurons,” Brain Res. Rev. 55(2), 220–227 (2007). Crossref, Google Scholar
- 14. , “Genetic dissection of neural circuits,” Neuron 57(5), 634–660 (2008). Crossref, Web of Science, Google Scholar
- 15. , “The TREES toolbox—probing the basis of axonal and dendritic branching,” Neuroinformatics 9, 91–96 (2011). Crossref, Web of Science, Google Scholar
- 16. , “L-Measure: A web-accessible tool for the analysis, comparison and search of digital reconstructions of neuronal morphologies,” Nat. Protocols 3(5), 866–876 (2008). Crossref, Web of Science, Google Scholar
- 17. , “RealNeuralNetworks. jl: An integrated julia package for skeletonization, morphological analysis, and synaptic connectivity analysis of terabyte-scale 3D neural segmentations,” Front. Neuroinf. 16, 828169 (2022). Crossref, Web of Science, Google Scholar
- 18. B. Celii et al., “NEURD: A mesh decomposition framework for automated proofreading and morphological analysis of neuronal EM reconstructions,” bioRxiv, doi:10.1101/2023.03.14.532674 (2023). Google Scholar
- 19. M. M. Bronstein, J. Bruna, Y. LeCun, A. Szlam, P. Vandergheynst, “Geometric deep learning: Going beyond euclidean data,” IEEE Signal Process. Mag. 34(4), 18–42 (2017). Google Scholar
- 20. , “A comprehensive survey on geometric deep learning,” IEEE Access 8, 35929–35949 (2020). Crossref, Google Scholar
- 21. , “Binary and analog variation of synapses between cortical pyramidal neurons,” Elife 11, e76120 (2022). Crossref, Web of Science, Google Scholar
- 22. , “Learning cellular morphology with neural networks,” Nat. Commun. 10(1), 2736 (2019). Crossref, Google Scholar
- 23. , “SyConn2: Dense synaptic connectivity inference for volume electron microscopy,” Nat. Meth. 19, 1–4 (2022). Crossref, Web of Science, Google Scholar
- 24. S. Seshamani et al., “Automated neuron shape analysis from electron microscopy,” arXiv: 2006.00100, 2020. Google Scholar
- 25. M. A. Weis et al., “Large-scale unsupervised discovery of excitatory morphological cell types in mouse visual cortex,” doi:10.1101/2022.12.22. 521541 (2022). Google Scholar
- 26. , “NeuroMorpho. Org: A central resource for neuronal morphologies,” J. Neurosci. 27(35), 9247–9251 (2007). Crossref, Web of Science, Google Scholar
- 27. , “Cortex, cognition and the cell: New insights into the pyramidal neuron and prefrontal function,” Cereb. Cortex 13(11), 1124–1138 (2003). Crossref, Web of Science, Google Scholar
- 28. , “Pyramidal neurons,” Curr. Biol. 21(24), R975 (2011). Crossref, Web of Science, Google Scholar
- 29. Q.-Y. Zhou, J. Park, V. Koltun, “Open3D: A modern library for 3D data processing,” arXiv: 1801.09847 (2018). Google Scholar
- 30. , CurvaNet: Geometric deep learning based on directional curvature for 3D shape analysis, Proc. 26th ACM SIGKDD Int. Conf. Knowledge Discovery & Data Mining, pp. 2214–2224 (2020). Crossref, Google Scholar
- 31. , Deep learning 3D shape surfaces using geometry images, Computer Vision–ECCV 2016,
Lecture Notes in Computer Science Book Series , Vol. 9910, pp. 223–240, Springer, Cham (2016). Crossref, Google Scholar - 32. , Pointnet: Deep learning on point sets for 3d classification and segmentation, Proc. IEEE Conf. Computer Vision and Pattern Recognition, pp. 652–660 (2017). Google Scholar


