Motor network reorganization in stroke patients with dyskinesias during a shoulder-touching task: A fNIRS study
Abstract
Hemiplegia after stroke has become a major cause of the world’s high disabilities, and it is vital to enhance our understanding of post-stroke neuroplasticity to develop efficient rehabilitation programs. This study aimed to explore the brain activation and network reorganization of the motor cortex (MC) with functional near-infrared spectroscopy (fNIRS). The MC hemodynamic signals were gained from 22 stroke patients and 14 healthy subjects during a shoulder-touching task with the right hand. The MC activation pattern and network attributes analyzed with the graph theory were compared between the two groups. The results revealed that healthy controls presented dominant activation in the left MC while stroke patients exhibited dominant activation in the bilateral hemispheres MC. The MC networks for the two groups had small-world properties. Compared with healthy controls, patients had higher transitivity and lower global efficiency (GE), mean connectivity, and long connections (LCs) in the left MC. In addition, both MC activation and network attributes were correlated with patient’s upper limb motor function. The results showed the stronger compensation of the unaffected motor area, the better recovery of the upper limb motor function for patients. Moreover, the MC network possessed high clustering and relatively sparse inter-regional connections during recovery for patients. Our results promote the understanding of MC reorganization during recovery and indicate that MC activation and network could provide clinical assessment significance in stroke patients. Given the advantages of fNIRS, it shows great application potential in the assessment and rehabilitation of motor function after stroke.
1. Introduction
Stroke is a common neurological disease that accounts for a major fraction of the world’s high disabilities.1 Stroke causes different function damage in patients,2 including hemiparesis, aphasia, cognitive impairment, motor impairment and so on. Numerous survivors have extremely inconvenient lives due to these dysfunctions. Therefore, it is vital to comprehend the brain reorganization and compensation mechanism after stroke and guide the rehabilitation based on these mechanisms,3 which is an essential component for developing efficient rehabilitation programs.4,5
Motor dysfunction is the most common function deficit after stroke.6 In recent years, brain imaging techniques, such as electroencephalography, functional magnetic resonance imaging (fMRI) and functional near-infrared spectroscopy (fNIRS), have been used to study brain activity changes and functional reorganization during motor recovery after stroke.7,8,9 Previous studies have shown that motor recovery in stroke patients is usually associated with changes in the brain activation pattern.10,11 For example, Miyai and colleagues used fNIRS to observe eight patients with initial stroke and found that recovery of motor function was related to the improved sensorimotor cortex and premotor cortex (PMC) activation on the impaired hemisphere.12 With worsening motor impairment, stroke patients not only show activation in the affected motor cortex (MC) but also exhibit functional compensation in the unaffected MC.13 Additionally, it is also found that activation of the affected hemisphere can predict better motor recovery,14 while hyperactivation of the unaffected hemisphere predicts motor deficits.15
Motor function in stroke patients is associated with altered brain connectivity. For example, in subacute stroke patients, there is a reduction in functional connectivity between the affected supplementary motor area and the unaffected primary motor cortex (M1) during voluntary hand movements.16 Wang and colleagues explored the dynamic changes in brain network topology during recovery in stroke patients with the graph theory, and found that the brain network shifted to a nonoptimal network structure with less functional isolation.17 Brain connectivity reorganization in stroke patients is also tightly related to their motor function during recovery. Previous studies have found a positive correlation between the interhemispheric connectivity in the bilateral PMC and M1 regions, and the extent of motor function recovery in stroke patients.18,19,20,21 Meanwhile, Cheng and colleagues found that the topology of brain networks can predict the recovery of motor function in stroke patients.22 Therefore, it is valuable to study brain reorganization during the recovery of motor function after a stroke.
The recovery of upper limb function post-stroke is extremely vital for the patient’s quality of life and reintegrating back into society.23 In this study, we would use fNIRS to study brain activation in the MC, and the reorganization of motor network in stroke patients during upper limb movements. FNIRS is a relatively new noninvasive brain functional imaging technique, which can detect concentration changes of oxyhemoglobin (Δ[HbO2]) and deoxyhemoglobin (Δ[Hb]) to reflect relative regional brain activity.24,25,26 FNIRS has favorable temporal and spatial resolution, and has the advantages of being low-cost, noninvasive, wearable, and insensitive to motion artifacts, allowing for long-term continuous monitoring.27,28 FNIRS is an effective tool for brain network analysis29 and has been widely used to study brain function reorganization and rehabilitation in the stroke context.9
In this study, we used a shoulder-touching task which is frequently used to evaluate stroke patients’ upper limb motor function, and investigated the MC activation and motor network topological properties in patients during this task using fNIRS. We also analyzed the relationship between the Fugl–Meyer assessment of the upper extremity (FMA-UE) scores and motor activation and brain network characteristics in stroke patients. We hypothesized that stroke patients and healthy subjects might show different brain activation and brain network patterns during upper limb tasks, which may be related to stroke patients’ upper limb motor function. This study is expected to provide supplementary indicators for the motor function assessment of stroke patients. It will help to understand the brain reorganization in the motor function recovery after stroke.
2. Materials and Methods
2.1. Subjects
Twenty-two stroke patients enrolled from the Chinese Medicine Rehabilitation Center of Beijing Rehabilitation Hospital Affiliated to Capital Medical University participated in this study. The patients’ ages ranged from 39 to 77 years. Inclusion criteria: (1) MRI or CT confirmation of the first unilateral stroke; (2) Glasgow Coma Scale score ≥8; (3) modified Ashworth score ≤2 points; (4) ability to keep the sitting position for at least six minutes; (5) Age: 39–80 years. Exclusion criteria: (1) previous experience with mental illness or taking antipsychotic medication; (2) having the following diseases: congestive heart failure, respiratory failure, deep vein thrombosis of the lower extremities, malignant progressive hypertension, active liver disease, severe liver or kidney insufficiency. FMA-UE was used to evaluate the patient’s motor function. The clinical characteristics of stroke patients are shown in Table 1. Meanwhile, 14 healthy subjects (seven females) were enrolled as the control subjects, with an age range of 48–70 years. All participants gave written informed consent and were informed of the basic requirements and procedures before the experiment. The Ethics Committee of Beijing Rehabilitation Hospital Affiliated to Capital Medical University reviewed and approved this study. The registration number for the clinical trial is ChiCTR2000040137.
| Subject | Gender | Age | Time after stroke onset (month) | Lesion location | Side of affected limb | FMA-UE |
|---|---|---|---|---|---|---|
| Subject 1 | M | 61 | 3.5 | L periventricular area | R | 44 |
| Subject 2 | M | 57 | 3 | R temporal lobe | L | 7 |
| Subject 3 | M | 64 | 4 | R periventricular area | L | 26 |
| Subject 4 | M | 68 | 1 | R basal ganglia, corona radiata, pontine | L | 10 |
| Subject 5 | F | 70 | 1 | R periventricular area | L | 47 |
| Subject 6 | F | 55 | 1 | R frontoparietal lobe, periventricular area | L | 6 |
| Subject 7 | F | 64 | 2 | R frontal lobe Abasal ganglia and corona radiata | L | 7 |
| Subject 8 | M | 69 | 2 | R thalamus, pontine | L | 15 |
| Subject 9 | F | 59 | 0.5 | R periventricular area, R pontine | L | 6 |
| Subject 10 | M | 62 | 0.5 | R thalamus, corona radiata | L | 6 |
| Subject 11 | M | 47 | 0.5 | R corona radiata, centrum semiovale | L | 4 |
| Subject 12 | M | 77 | 0.55 | L periventricular area | R | 48 |
| Subject 13 | M | 50 | 1 | L basal ganglia, periventricular area | R | 50 |
| Subject 14 | M | 69 | 0.31 | R basal ganglia | L | 13 |
| Subject 15 | M | 39 | 1 | L frontotemporal parietal occipital lobe | R | 40 |
| Subject 16 | F | 50 | 1 | R cerebellar, temporal lobe, midbrain, basal ganglia, cerebral infarction in the occipital lobe with multiple infarcts | L | 4 |
| Subject 17 | F | 76 | 1.5 | R temporal lobe, basal ganglia, periventricular area, corona radiata multiple infarcts | L | 8 |
| Subject 18 | M | 63 | 5 | R thalamus | L | 54 |
| Subject 19 | F | 71 | 2 | R basal ganglia, corona radiata | L | 4 |
| Subject 20 | M | 66 | 0.31 | L pontine | R | 52 |
| Subject 21 | M | 56 | 0.5 | L periventricular area | R | 36 |
| Subject 22 | M | 68 | 2 | L periventricular area | R | 7 |
2.2. Task paradigm
The experiment was conducted in a separate and quiet room, which was air-conditioned to a moderate temperature. All participants remained in a resting state for a while before the formal experiment to ensure that the cerebral oxygenation data was stable. The experiment was block designed, and the rest block and the task block were all 30s and appeared alternately three times (Fig. 1). During the rest block, the subject was seated in a chair comfortably upright, with upper limbs naturally hanging down at both sides of the body and lower limbs naturally relaxed and bent at 90∘. During the task block, the subject lifted the arm from the hemiplegic side on the sagittal plane to the horizontal plane, then flexed the elbow and touched the opposite shoulder with the palm from the hemiplegic side. For healthy participants, the right hand was used to touch the opposite shoulder. Finally, the upper limb naturally returns to the initial position. Each patient completed the shoulder-touching task independently at a controllable speed. Before the formal experiment, the researchers explained the experimental requirements to subjects and demonstrated the key movements. The subjects practiced several times until they became proficient.
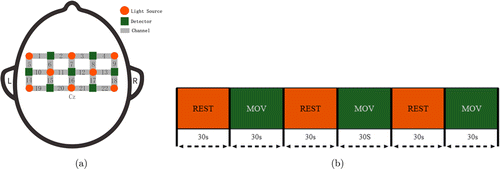
Fig. 1. (a) The schematic of fNIRS channel locations on the head; (b) experimental procedure.
2.3. Data collection
The ETG-4000, an fNIRS device manufactured by Hitachi was used to measure the cerebral hemodynamic signals from each subject’s MC. The device consisted of seven detectors and eight emitters (light sources), making up 22 channels. The distance between the emitter and the detector was 30mm. The ETG-4000 detects light intensity changes at wavelengths of 695nm and 830nm and can measure Δ[HbO2] and Δ[Hb] based on the Beer-Lambert law.30 With reference to the 10/20 electrode placement system, Cz was used as the reference anchor point for placing the NIRS probe (Fig. 1), the lower edge of the probe is parallel to the sagittal plane. The sampling frequency was 10Hz.
2.4. Data pre-processing
PYTHON was used to process the fNIRS data. Due to the higher signal-to-noise ratio of Δ[HbO2] compared to Δ[Hb],31 only Δ[HbO2] were analyzed in this study. To reduce the impact of scalp blood flow artifact, we used the independent component analysis (ICA) algorithm to spatially decompose the time series of Δ[HbO2] for each subject, removed unnecessary components and reconstructed Δ[HbO2] using an inverse process.32 Motion artifacts were then removed using the cubic spline interpolation method.33 Finally, we used a fourth-order Butterworth bandpass filter at 0.01–0.2Hz to remove physiological noise to further improve the signal-to-noise ratio. As the lesion areas of stroke patients were not on the same hemisphere, we uniformly flipped the left and right hemispheres in patients with left-sided paralysis before further analyses.34 The processed data are shown in Fig. 2.
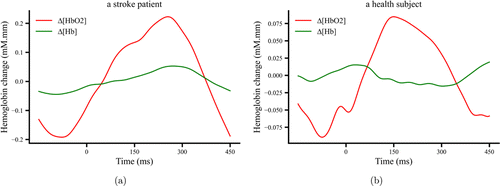
Fig. 2. The time course of Δ[HbO2] and Δ[Hb] after preprocessing at a typical channel (Ch 5) for the movement task from a stroke patient (a) and a healthy subject (b).
2.5. Brain activation and lateralization index
The time series of Δ[HbO2] was preprocessed, then block averaged to calculate the mean activation value of the movement task at each channel for each participant after subtracting the mean activation of the REST task. The mean activation values of the participant’s left and right hemispheres were used to calculate the lateralization index (LI), which ranges from −1 to 1. When LI>0.1, the left hemisphere is dominant, when LI<−0.1, the right hemisphere is dominant, and when |LI|≤0.1, the activation patterns were categorized as bilateral.35 LI is calculated according to Eq. (1)
2.6. Small-world properties
We used the graph theory to examine the properties of the motor network during the movement task. The 22 fNIRS channels were used as nodes in the network, and correlation coefficients between two channels calculated by Pearson correlation analysis were edges in the network. First, the hemodynamic time series for the averaged task block (30s) was used to obtain a correlation coefficient matrix of 22×22, and then the matrix was performed a Fisher’s R to Z transformation to improve the normality. A threshold of 0.3–0.8 (step size of 0.01) was then used to sparse the network,36 the Z-score matrix was converted to the absolute value and ordered from the largest to the smallest. A connection was allocated a value of 1 when the absolute value is greater than a threshold, otherwise, a value of 0 was allocated to eliminate weakly correlated or irrelevant connections in the network, resulting in a binary network at the corresponding threshold. We calculated eight network parameters: clustering coefficient (C), characteristic path length (L), GE, local efficiency (LE), transitivity (T), small-worldness (σ), average connectivity (ˉK), (LC, and short connection (SC).
(1) Clustering coefficient (C)
The clustering coefficient for a node (Eq. (2)) represents the degree of connectivity between the node and its neighbors.
Among them, ei represents the number of neighboring nodes directly connected to node i, ni is the degree of node i, and Ci is the clustering coefficient of node i.
The clustering coefficient (Eq. (3)) of the entire network is the average of all nodes’ clustering coefficients.
(2) Characteristic path length (L)
The characteristic path length (Eq. (4)) represents the average of all shortest paths between pairs of nodes. di,j represents the minimum number of edges required to connect nodes i and j.
(3) GE
The GE (Eq. (5)) is a measure of overall network transmission efficiency, and it is the average of efficiencies between nodes.
(4) LE
The LE (Eq. (6)) is the averaged GE of the subgraphs formed by the neighbors of a node. In Eq. (6), Gi is denoted as the subgraph of the nearest neighbor of node i.
(5) Small-worldness (σ)
The small-worldness of a network is calculated as follows (Eq. (7)),
Among them, C and L denote the clustering coefficient and characteristic path length of the real network, respectively. Crand and Lrand denote the averaged C and L of 100 random networks, respectively. If σ≥1, the network has small-world properties.
(6) Transitivity (T)
The transitivity (Eq. (8)) represents the relative number of triangles in the network, reflecting the probability that two regions are adjacent to each other,
(7) Average connectivity (ˉK)
The average connectivity (Eq. (9)) represents the average of the local node connectivity over all pairs of nodes in the graph. In Eq. (9)), p is the order of the graph and represents the total connectivity, KG(u,v) is the number of edges with no common points, C2p is the maximum number of edges of the graph.
(8) LC and SC
A LC (Eq. (10)) consists of two nodes in the graph, where there is at least one other node between the shortest path of the two nodes. A SC (Eq. (11)) does not have any other node between the shortest path of the two nodes.
2.7. Statistical analyses
To exclude the influence of the threshold on the brain network parameters, the area under the curve (AUC) for each parameter was analyzed in this study.37,38 When the channel activation values and the AUC of the brain network characteristics of the two groups conformed to a normal distribution (Shapiro–Wilk test) and equality of variance (Levene test), independent samples t-tests (two-tailed test) were used for comparison, otherwise the Wilcoxon rank sum test was used. The relationship between the channel activation values, the AUCs of network parameters and patients’ FMA-UE was also analyzed by using partial correlation with age as a control variable. The level of statistical significance was set to 0.05.
3. Results
3.1. Brain activation and LI results
Figure 3 shows the mean activation at each channel for the two groups. In the shoulder-touching task, the LI of the stroke group was −0.009, showing a bilateral MC activation, while the LI of the healthy control group was 0.268, showing the left hemisphere activation dominance. The stroke group had significantly higher activation in channels 8/12/13 in the right brain (Ch 8: t=2.41, p=0.0214; Ch 12: t=2.23, p=0.0328; Ch 13: t=2.61, p=0.0134) than the healthy group.
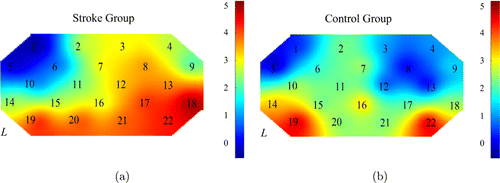
Fig. 3. The brain activation maps during the shoulder-touching task for the stroke (a) and healthy (b) groups.
3.2. Brain network results
Figure 4 shows the trends of seven network topological properties with the threshold. As the threshold increases, the small-worldness and characteristic path length show an increasing trend, with average connectivity, clustering coefficients and transitivity decreasing along with disconnection. The GE and LE also decrease along the threshold increment. At the threshold range of 0.3–0.8, the brain networks showed small-world properties for both groups (σ>1). The AUCs of GE and average connectivity of the stroke group were lower compared to that of the healthy group (GE-AUC: t=−2.21, p=0.0273; ˉK-AUC: t=−2.38, p=0.0231), but the AUC of transitivity was higher in the stroke group than the healthy group (T-AUC: t=2.29, p=0.0283).
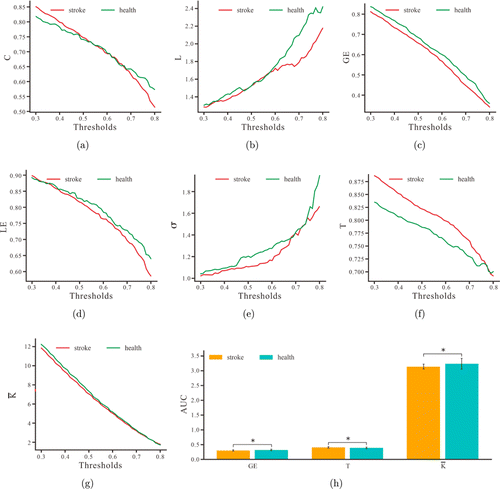
Fig. 4. The mean Clustering coefficient: C (a), Characteristic path length: L (b), Global efficiency: GE (c), Local efficiency: LE (d), Small-worldness: σ (e), Transitivity: T (f), and Average connectivity: ˉK (g) for patients and healthy subjects at each threshold. (h) AUC indicators of the three small-world properties for the two groups. * indicates p<0.05.
To further understand the properties of the motor network, we also analyzed the short and LCs of the network. Figure 5 shows the LC and SC within and between hemispheres. The statistical results showed that the AUC of LC in the left hemisphere was lower in the stroke group compared to that of the healthy group (t=−2.15, p=0.0387).
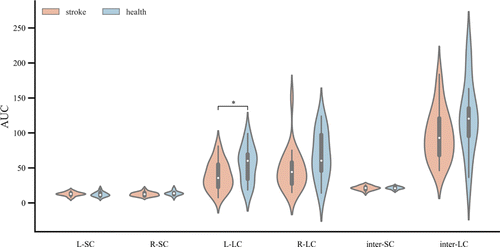
Fig. 5. The AUCs for LC and SC within and between hemispheres for the two groups. * indicates p<0.05.
3.3. Brain activation and small-world attributes correlation with FMA-UE
We performed partial correlation analyses between FMA-UE and the brain activation and network properties of stroke patients. The results showed that the activation at four channels had a positive correlation with patients’ FMA-UE (Ch 16: r=0.5, p=0.018; Ch 17: r=0.513, p=0.015; Ch 20: r=0.444, p=0.038; Ch 21: r=0.46, p=0.031). The AUC of transitivity was inversely correlated with patients’ FMA-UE (r=−0.609, p=0.003) and the AUC of the average connectivity was positively correlated with patients’ FMA-UE (r=0.601, p=0.003). These significant correlations are shown in Fig. 6.
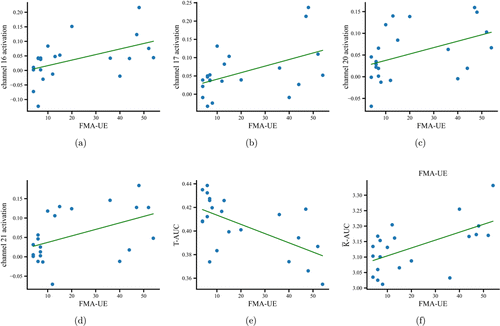
Fig. 6. Scatterplots of significant correlations between FMA-UE and brain activation at channels 16 (a), 17 (b), 20 (c), and 21 (d). (e) and (f) show the scatterplots of significant correlations between FMA-UE and AUCs of T and ˉK.
4. Discussion
In this study, we investigated the MC activation and network reorganization during a shoulder-touching task for stroke patients and explored the association between this brain reorganization and patients’ upper limb motor function. We found that the stroke group had bilateral MC activation during the movement task, while the healthy group had a dominant left hemisphere activation. The motor networks had small-world properties for both groups, but the transitivity of the stroke group was higher than that of the healthy group, while the GE, average connectivity, and LC in the left hemisphere were reduced in the stroke group compared to the healthy group. Both brain activation and network properties in stroke patients correlated with their upper limb motor function.
Our study found that the MC of stroke patients showed bilateral activation during movement, and the right hemisphere was involved in compensation. Functional compensation in unaffected brain regions has been widely reported. For example, Lim and colleagues used fNIRS to analyze the activation of the sensorimotor cortex during upper limb extension and grasping in stroke patients and found that despite poorer motor performance in the stroke group, cortical activation increased significantly on the ipsilateral side of the moving limb compared to healthy controls.34 Similarly, Cramer and colleagues found that stroke patients had higher activation in the sensorimotor cortex of the unaffected hemisphere during left- and right finger-tapping experiment compared to healthy participants.39 In our study, we also found that the activation of some left and right motor brain regions was positively correlated with FMA-UE, indicating that the greater the compensatory ability of the unaffected side, the better the upper limb motor function recovery in stroke participants. In addition, McCambridge and colleagues also stated that in severely injured patients, inhibition of the motor area of the unaffected hemisphere may not be beneficial.40 Therefore, the reliance on the unaffected motor areas might be an important component of motor recovery.
The average connectivity and GE of stroke participants were lower than that of healthy participants, indicating that the damaged areas of the stroke participants affected the information processing capacity of functional brain networks. With lower network robustness and integration,41,42 stroke participants needed to activate other brain areas to perform the shoulder-touching task to compensate for the damaged brain areas. Shi and colleagues also found that the GE and small-worldness σ decreased in the resting state for stroke participants compared to healthy participants, and the brain network began to shift toward a regular structure.38 In our study, the LCs in the left MC of stroke participants reduced, and we speculate that it might be due to sparse interregional connections between the affected brain regions and the high degree of isolation between regions This is consistent with the study by Yin et al., which found that stroke participants had reduced connectivity across multiple brain regions compared to healthy participants.43 A higher FMA-UE score was associated with less transitive and greater average connectivity of the patients’ brain network. This indicates that as the high clustering of the MC network improves, the upper limb motor function gradually improves, and patients’ damaged areas begin to gradually return to normal. We suggest that the transitivity and average connectivity of the MC network can be used as a feedback indicator to assess the recovery of upper limb motor function in stroke patients.
There are some limitations for this study. First, the number of subjects was relatively small. There were only 22 stroke patients and 14 healthy controls, and more stroke patients must be recruited to verify its results. Second, the lesion location and size were not consistent in patients. However, lesions in different locations that cause the same symptom may be linked to common networks.44 In addition, compared with local lesions, there was greater consistency between the network connectivity lesions and clinical symptoms, especially for the motor and attention networks in stroke patients.45 Therefore, we investigated patients’ MC network changes and its correlation and patients’ motor dysfunction. In the future, we will recruit more patients and further validate our results by controlling patients’ insult sites. Thirdly, concerning data preprocessing, we used the ICA method to remove the superficial interference. However, it is recommended that the short-distance measurements as regressors in a General Linear Model is more effective.46 Since ETC-4000 is not configured for short-distance measurement, we cannot use short channels to remove the influence of surface interference. Finally, the fNIRS montage might be different across subjects, it is better to build 3D models of different subjects to ensure the fNIRS montage consistency.
5. Conclusions
In this study, we found that stroke patients showed bilateral motor activation during the shoulder-touching task, with the right hemisphere involved in compensation. The greater the compensatory capacity of the unaffected motor areas, the better the stroke patients’ upper limb motor function. The increase in transitivity and average connectivity of patients’ brain network demonstrated an increase of clustering in patients’ MC network, while a decrease in GE denoted a decrease in the integration capacity of the brain. Our results promote the understanding of MC reorganization during recovery and indicate that MC activation and network could provide clinical assessment significance in stroke patients. Given the advantages of fNIRS, it shows great application potential in the assessment and rehabilitation of motor function after stroke.
Acknowledgments
This study was supported by the National Key Research and Development Program of China (Nos. 2020YFC2004300, 2020YFC2004303 and 2020YFC2004302), the National Natural Science Foundation of China (Nos. 32000980 and 82171533), the Guangdong Basic and Applied Basic Research Foundation (Nos. 2022A1515140142, 2019A1515110427 and 2020B1515120014) and the Key Laboratory Program of Guangdong Higher Education Institutes (No. 2020KSYS001). We would like to thank all subjects for their participation. Y. Zhang, D. Wang and D. Wang contributed equally to this paper.
Conflict of Interest
The authors declare no conflict of interest.

