Comparison of the emission wavelengths by a single fluorescent dye on in vivo 3-photon imaging of mouse brains
Abstract
Multiphoton microscopy (MPM) is a powerful imaging technology for brain research. The imaging depth in MPM is partly determined by emission wavelength of fluorescent labels. It has been demonstrated that a longer emission wavelength is favorable for signal detection as imaging depth increases. However, there has been no comparison with near-infrared (NIR) emission. In order to quantitatively analyze the effect of emission wavelength on 3-photon imaging of mouse brains in vivo, we utilize the same excitation wavelength to excite a single fluorescent dye and simultaneously collect NIR and orange-red emission fluorescence at 828nm and 620nm, respectively. Both experimental and simulation results show that as the imaging depth increases, NIR emission decays less than orange-red fluorescent emission. These results show that it is preferable to shift the emission wavelength to NIR to enable more efficient signal collection deep in the brain.
1. Introduction
Multiphoton microscopy (MPM) is a nonlinear optical technology.1,2,3,4,5 It has been widely used on in vivo brain imaging, the quest for lager imaging depth is one of its main goals.6,7 By studying the absorption and scattering of excitation light in biological tissue, researchers managed to locate several optical windows where the combined effect of light attenuation is relatively low.8,9 These results provide guidelines for the selection of excitation light in deep-brain MPM.10 The optical windows usually refer to the 800nm band (NIR-I), the 1300 nm band (NIR-II) and the 1700nm band (NIR-III). At the 800nm excitation band, Chris et al. obtained images of blood vessels in living mouse brain at depth of 0.5mm, using two-photon microscopy.11 At the 1300nm excitation band, they were able to image the brain vessels at a depth of 1.6mm.12 As for 1700nm excitation band, the largest imaging depth to date for multiphoton brain imaging in living mice, 2.1mm, was achieved.13
At present, researchers have attempted to systematically study the effect of emission wavelengths on multiphoton brain imaging. They use the same excitation wavelength to excite various fluorescent dyes in the same mouse for the sake of studying fluorescent signal attenuation at different emission wavelengths.14 Their experimental results show that within the depth of 1mm in multiphoton imaging, the difference for fluorescence collecting efficiency among green (520nm), red (615nm) and NIR (711nm) emission fluorescence dye, is less than a factor of 2. They consider this difference or impact is not significant, and therefore they deem that better performance of long wavelength dyes in deep multiphoton imaging mainly comes from long excitation wavelengths, rather than long emission wavelengths. However, to synchronously obtain fluorescence signals at different emission bands, they injected each mouse with two kinds of dyes in the experiments, forcing them to account for the interaction between the dyes when assessing the effects of emission wavelengths. Although the multiphoton microscope constructed by them can achieve dual-channel fluorescence signal acquisition, the two channels are not completely symmetrical in structure, which leads to inconsistent optical path. This is a negative factor for evaluating the influence of emission wavelengths. In addition, their discussion is restricted to the imaging depth of less than 1mm, that is obviously not enough for 3-photon brain imaging which can easily achieve 1.5 − 2mm imaging depth nowadays.
In view of the drawbacks of the previous studies, the experimental scheme in this paper decided to use only a single dye to study the effects of emission wavelengths, and designed two fluorescence collection channels with completely symmetric structure. According to our experimental results, multiphoton fluorescence signals with central emission wavelength of 828nm and that of 620nm were simultaneously acquired at imaging depth of more than 1.6mm, below the white matter, deep into the hippocampus. Compared with the existing studies, we carried out related experiments with longer emission wavelength and deeper imaging depth.
Our work revealed the effects of emission wavelengths on in vivo 3-photon mouse brain imaging in a deep depth. Using a single fluorescent dye avoided the discussion of dye interactions. Also, the scheme of symmetric double fluorescence collecting channels eliminated the influence of relative scattering between them. At last, we compared our experiment data with the simulation results by Monte Carlo.
2. Materials and Methods
2.1. Imaging setup
Our experimental setup consists of a soliton light source and a laser scanning microscope, as shown in Fig. 1(a).15,16 The 1700nm excitation soliton light was generated through soliton self-frequency shift (SSFS) in a photonic-crystal rod (SC-1500/100-Si-ROD, NKT Photonics), pumped by a 1550nm fiber laser (FLCPA-02CSZU, Calmar). A 1635nm long-pass filter (1635LPF, Omega Optical) was used to remove the residual light. The measured 1700nm soliton spectrum is shown in Fig. 1(b). After the customized coating objective lens, its maximum optical power was ∼75mW.
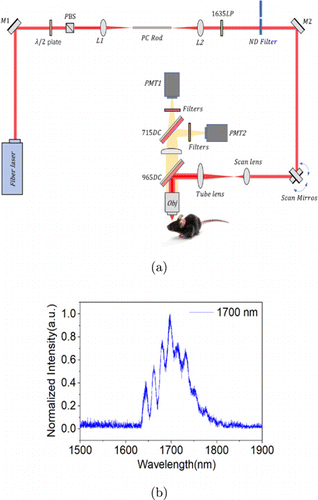
Fig. 1. (a) Experimental setup for comparison of the emission wavelengths with 3-photon microscopy. Fiber laser: 1550nm fiber laser; M1, M2: Silver-coated mirror; /2 plate: Half-wave plate; PBS: Polarization beam splitter; L1, L2: Lens; PC Rod: Photonic crystal rod; 1635LP: 1635nm long pass filter; ND Filter: Neutral density filter; 715DC, 965DC: 715nm and 965nm dichroic mirror; PMT1, PMT2: GaAs photo-multiplier tube and GaAsP photo-multiplier tube; Obj: Custom coated Objective. (b) The measured spectrum for 1700nm soliton pulses.
Our laser scanning microscope was based on a Movable Object Microscope (MOM, Sutter Instrument).17 It has an asymmetric detection path: The detected multiphoton signals reach the first optical filter 1 which is mounted in front of PMT 1. Some signals within the passing band of filter 1 thus go through filter 1 and are detected by PMT1. The remaining signals are reflected from filter 1 and propagates further to filter 2 mounted in front of PMT2. As a result, the optical path length for signals from the sample to PMT 2 is longer than that to PMT1, which makes the detection path asymmetric for the MOM. In this paper, a dichroic mirror was used to divide the fluorescence into two parts, which entered two fluorescence detection channels, respectively. In this way, the two fluorescence detection channels are symmetrical in structure, and the collected fluorescence is equal in optical path. Another advantage of the detection method we adopted is that the path of fluorescence to the detector is reduced, which is conducive to improve the efficiency of fluorescence collection.
In our emission wavelengths comparison experiment, the fluorescence was separated by a 715nm dichroic mirror (715DC, T715lpxrxxt-UF1, Chroma). The bandpass filters 835/70nm (835/70BP, FF01-835/70-25, Sermrock) and 810/90nm (810/90BP, ET810/90m, Chroma) were positioned in front of GaAs PMT (H7422P-50, Hamamatsu) to collect NIR emission fluorescence while 593nm long-pass filter (593LP, FF01-593/LP-25, Sermrock) and bandpass filter 610/75nm (610/75BP, ET610/75m-2p-18deg, Chroma) were positioned in front of GaAsP PMT (H7422p-40, Hamamatsu) to collect orange–red emission fluorescence. Since the two PMTs are different, their detection efficiency curves are given in Fig. 2.
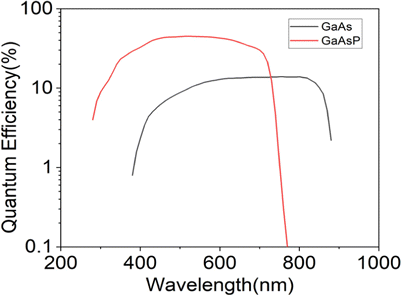
Fig. 2. Quantum efficiency of GaAs PMT and GaAsP PMT at different wavelengths.
While the fluorescent dye is excited, the generated fluorescence is first collected by the objective lens, then reflected by 965nm dichroic mirror (T965lpxrxxt-UF1, Chroma) and then separated by 715DC. The fluorescence, emission wavelength greater than 715nm and that less than 715nm enter two different imaging channels. As a result, we were able to filter out the 800–855nm near-infrared (NIR) emission band fluorescence in the one channel with 835/70BP and 810/90BP, and 593–647.5nm (orange–red) emission band fluorescence in the other channel with 593LP and 610/75BP. In terms of images acquisition, it was completed by ScanImage, and the related parameters were set as two average frames, 5m step, 2ms/line and 512 pixels×512 pixels.
2.2. Measurement of 3-photon excitation and emission properties of FM4-64
In order to verify the 3-photon excitation characteristics of FM4-64 dye at the 1700nm band, we used a self-built multiphoton system to obtain its power dependence of the fluorescence signal. The FM4-64 dye sample was excited by a 1700nm soliton laser generated from a LMA fiber (LMA-PM-35, NKT photonics), pumped by a 1M Hz, 1550nm femtosecond fiber laser (FLCPA-02CSZU, Calmar). The power reaching the sample surface was controlled by a variable neutral density filter (NDC-50C-4M, Thorlabs), and the fluorescence at different power levels was recorded by a photon counter (SR400, SRS). Furthermore, we measured the in vivo 3-photon excited emission spectrum of FM4-64 dye. The EMCCD spectrometer (SpectraPro HRS-300, Princeton Instruments) was introduced into our multiphoton microscope for the measurement. These steps are similar to those described in our existing works.18,19
2.3. Animal procedures
Each mouse (∼8 weeks old, female, C57BL/6J, Guangdong Medical Laboratory Animal Center) underwent craniotomy and dye injection before 3-photon imaging of the brain. The scalp of the mouse was cut with surgical scissors to expose its skull, and a 3mm diameter piece of skull, centered 2mm posteriorly lateral to the Bregma point, was removed with an electric bone drill. Hence, a cranial window was formed with the dura intact. The cranial window was then covered with a 5mm transparent coverslip. A homemade head ring was used to fix the mouse skull. The coverslip was secured to the skull with dental cement. Enflurane gas was used to keep the mouse under anesthesia and a heated blanket was used to maintain its body temperature. After the optical cranial window was prepared, the FM4-64 fluorescent dye with volume of 200L was injected into its veins by means of orbital injection. Thereinto, the concentration of FM4-64 was 500M/L, diluted with normal saline. With the help of blood circulation, the fluorescent dye was soon distributed into the systemic blood vessels.
3. Results
3.1. Measured 3-photon excitation and emission properties of FM4-64
First, we characterized 3-photon properties of FM4-64. Measured fluorescent signal versus excitation power for FM4-64 solution at 1700nm is shown in Fig. 3(a). The fitted slope is 2.93 on logarithmic scale, indicating that fluorescence is indeed 3-photon. Pertinent to this emission wavelength comparison experiment is the 3-photon emission spectrum in vivo, which is shown in Fig. 3(b). It can be seen that FM4-64 has a broad 3-photon emission spectrum, with an emission peak at 740nm and spanning from 590nm to 850nm. This is why we chose FM4-64 as the fluorescent dye in this experiment. We chose to compare two emission bands from 593nm to 647.5nm and from 800nm to 855nm, as illustrated in Fig. 3(b).
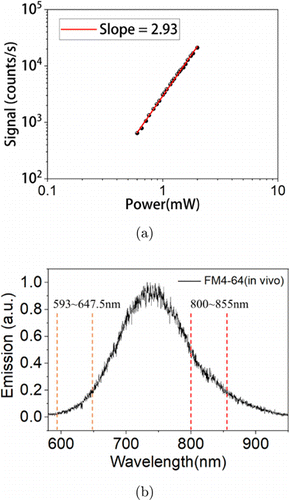
Fig. 3. Measured 3-photon excitation and emission properties of FM4-64. (a) Signal versus power on the sample of FM4-64 excited at 1700nm. (b) 3-photon emission spectrum for FM4-64 in vivo, together with the two emission bands compared in this experiment.
3.2. In vivo 3PM of mouse brain
Having characterized the 3-photon properties of FM4-64, next, we performed in vivo 3-photon fluorescence imaging for signal comparison. Representative in vivo 3-photon imaging results of the mouse brain are shown in Fig. 4. The imaging depth of nearly 1700m below the brain surface is obtained in both NIR and orange-red emission bands. THG signals were also acquired to identify the white matter layer, above and below which are the neocortex and the hippocampus layer, respectively. THG images show that the white matter layer spans from 810m to 960m below the brain surface, below which is the hippocampus.20,21 Below white matter, 3-photon fluorescence images of blood vessels show descent signal to noise ratios for both emission bands down to 1700m. This enables us to compare the effects of different emission wavelengths down to the hippocampus.
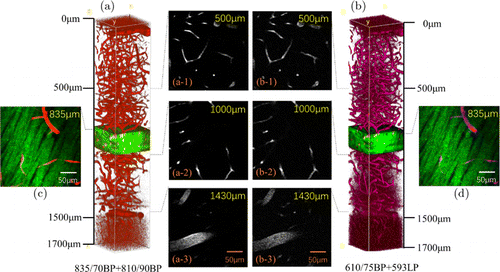
Fig. 4. 3D reconstruction of mouse brain blood vessels and fluorescent images at different depths. (a) Volume view of brain vessels constructed by NIR emission fluorescence. (a-1)–(a-3) NIR emission fluorescent images at depth of 500m, 1000m and 1430m. (b) Constructed by orange-red emission fluorescence. (b-1)–(b-3) Orange-red emission fluorescent images. (a-1)–(a-3) and (b-1)–(b-3) are normalized contrast images. (c) Image at depth of 835m. Green: THG signals of white matter; Red: NIR emission fluorescent signals of blood vessels. (d) Magenta: Orange-red emission fluorescent signals.
4. Discussion
4.1. Comparison of 3PF signals at different emission wavelengths
The fluorescent signals at each depth were calculated according to the images collected synchronously. The specific steps include performing median filtering on each image, taking the average value of 0.1% of the brightest pixels, subtracting the background signal and then dividing by the corresponding power cubic. For the images of three repeated experiments, we take the signal ratio of NIR emission fluorescence and orange-red emission fluorescence at each depth. Further, the ratios at near surface depth of 40m are all normalized as 1, as seen in Fig. 5.
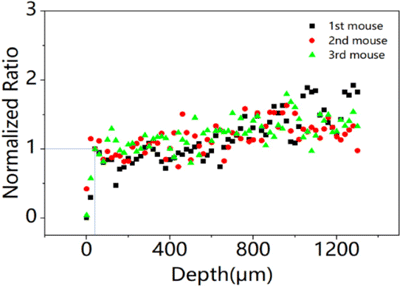
Fig. 5. Normalized ratio of NIR and orange-red fluorescent signals at each depth.
The results show that the effect of emission wavelength on 3-photon brain imaging is related to the imaging depth, this effect floats up with the increasing of imaging depth. As the imaging depth rises to 1300m, the ratio increases to no more than 1.9. However, when the imaging depth rises continuously, this ratio decreases rapidly, which is believed to be caused by the decline of the signal-to-background ratio (SBR) of the fluorescent images at the imaging depth above 1300m. The results of this section, imaging depth over than 1300m, cannot accurately reflect the relationship between their ratio and imaging depth. In other words, if the emission fluorescence can obtain a sufficiently good SBR image at the greater depth, the upward trend of their ratio will continue.
4.2. Fluorescent Monte Carlo simulation
Monte Carlo simulation is widely used in the study of the interaction between photons and biological tissue.22,23,24,25 In order to better understand the experimental results, we used Monte Carlo to simulate the photon propagation in brain tissue at different emission wavelengths and detailed instructions of the code are at https://omlc.org. Suppose fluorescent photons propagate in a semi-infinite monolayer medium, the size of the bins for depth, dz, and radial position, dr are both set as 0.01cm. 106 photons were emitted at different depths from the surface, and the number of photons escaping to the surface within the specified radius is counted. For NIR and orange-red emission bands, we simulated the center wavelengths nm and nm were taken respectively. The scattering coefficients, [cm], of the two wavelengths of light in living mouse brain were given by the Mie scattering theory.26 We calculated the absorption coefficients of blood at 828nm and 620nm based on the absorption coefficients, [cm] of oxygenated whole blood (150g hemoglobin/liter or M), deoxygenated whole blood, water, melanin and fat in the range of 300–1000nm and the amount of these components in the blood.27 The absorption of light in a living mouse brain is dominated by blood, and the absorption coefficient of brain tissue should be the product of the absorption coefficient of light by blood and blood content, which in living mice is 3%.28 Absorption and scattering coefficients are summarized in Table 1.
| Coefficients | [cm] | [cm] |
|---|---|---|
| (828nm) | 0.144 | 67.5 |
| (620nm) | 0.372 | 105.8 |
Since the front aperture of our objective lens is 6.2mm, we chose to count the numbers of photons escaping from the tissue surface within a radius of 0.31cm, in order to obtain the relationship between the number of photons reaching to the surface and the depth of the emitted photon position at two different wavelengths. At last, we get the ratio of the normalized escaped photons at wavelength of 828nm and 620nm at each depth. Their ratio is plotted in Fig. 6. The average ratio at each same depth from 40m to 1300m for the three repeated experiments is also plotted in Fig. 6. Our simulation results show that with the increasing of imaging depth, the ratio will keep growing, at 1300m depth, it comes to about 1.14 times of that at the surface. Simulation of Monte Carlo predicts an upward trend of the fluorescent signal ratio at 828nm and 620nm wavelength when they escape from a monolayer medium. The simulation results are in agreement with experimental results in unveiling that NIR light escapes more efficiently than orange-red light in brain.
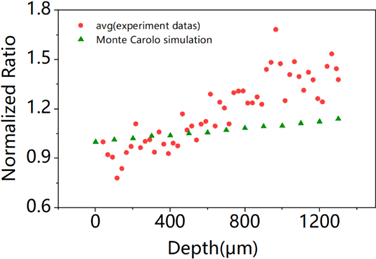
Fig. 6. Monte Carlo simulated ratio of normalized escaped photons at wavelength of 828nm and 620nm, at different depths.
5. Conclusions
We systematically compared the attenuation of NIR and orange-red emission fluorescence on in vivo 3PM of mouse brains utilizing a single fluorescent dye. According to the experimental results, we found that within 1.3mm imaging depth, orange-red fluorescence escapes less than that of NIR emission fluorescence, and the difference between them showed an obvious dependence with the imaging depth. Monte Carlo simulation further corroborates this conclusion. In our emission wavelength comparison experiments, the influence factor of emission wavelengths is always less than 1.9. With respect to deep-brain MPM, it is preferable to use NIR fluorescence to gain better signal detection efficiency as imaging depth increases.
Acknowledgments
This work is funded by the National Natural Science Foundation of China (Grant/Award Numbers 62075135 and 61975126), Shenzhen Science and Technology Planning Project (ZDSYS20210623092006020), Key R&D Program of Shandong Province (Grant Number 2021CXGC010202), the Science and Technology Innovation Commission of Shenzhen (Grant/Award Numbers JCYJ20190808174819083 and JCYJ20190808175201640) and Natural Science Foundation of Shandong Province (Grant Number ZR2022MA046), Major Innovation Projects for Integrating Science, Education & Industry of Qilu University of Technology (Shandong Academy of Sciences, Grant Number 2022JBZ01-04).
Conflicts of Interest
The authors declare that there are no conflicts of interest relevant to this paper.
References
- 1. , “Two-photon laser scanning fluorescence microscopy,” Science 248, 73–76 (1990). Crossref, Web of Science, Google Scholar
- 2. , “Nonlinear optical microscopy: From fundamentals to applications in live bioimaging,” Front. Bioeng. Biotechnol. 8, 585363 (2020). Crossref, Web of Science, Google Scholar
- 3. , “Nonlinear optical imaging by detection with optical parametric amplification,” J. Innov. Opt. Health Sci. 16, 2245001–2245010 (2023). Link, Web of Science, Google Scholar
- 4. , “Lipid droplets imaging with three-photon microscopy,” J. Innov. Opt. Health Sci. (2022). https://doi.org/10.1142/S179354582250033X. Web of Science, Google Scholar
- 5. , “The development of fluorescence microscopy,” Encyclopedia Life Sci. 1–9 (2010). https://doi.org/10.1142/S1793545822430040. Google Scholar
- 6. , “In vivo three-photon microscopy of subcortical structures within an intact mouse brain,” Nat. Photon. 7, 205–209 (2013). Crossref, Web of Science, Google Scholar
- 7. , “Roadmap on wavefront shaping and deep imaging in complex media,” J. Phys. Photon. 4, 042501 (2022). Crossref, Google Scholar
- 8. , “A review of the optical properties of biological tissues,” IEEE J. Quantum Electron. 26, 2166–2185 (1990). Crossref, Web of Science, Google Scholar
- 9. , “Analysis of optical properties of the mouse cranium—Implications for in vivo multi photon laser scanning microscopy,” J. Neurosci. Meth. 178, 316–322 (2009). Crossref, Web of Science, Google Scholar
- 10. , “Effect of excitation wavelength on penetration depth in nonlinear optical microscopy of turbid media,” J. Biomed. Opt. 14, 010508 (2009). Crossref, Web of Science, Google Scholar
- 11. , “Deep tissue multiphoton microscopy using longer wavelength excitation,” Opt. Exp. 17, 13354–13364 (2009). Crossref, Web of Science, Google Scholar
- 12. , “In vivo two-photon microscopy to 1.6-mm depth in mouse cortex,” J. Biomed. Opt. 16, 106014 (2011). Crossref, Web of Science, Google Scholar
- 13. , “In vivo deep-brain structural and hemodynamic multiphoton microscopy enabled by quantum dots,” Nano Lett. 19, 5260–5265 (2019). Crossref, Web of Science, Google Scholar
- 14. , “Impact of the emission wavelengths on in vivo multiphoton imaging of mouse brains,” Biomed. Opt. Exp. 10, 1905–1918 (2019). Crossref, Web of Science, Google Scholar
- 15. , “Deep-skin third-harmonic generation (THG) imaging in vivo excited at the 2200nm window,” J. Innov. Opt. Health Sci. 2243004 (2022). https://doi.org/10.1142/S1793545822430040. Web of Science, Google Scholar
- 16. , “3-photon fluorescence and third-harmonic generation imaging of myelin sheaths in mouse digital skin in vivo: A comparative study,” J. Innov. Opt. Health Sci. 15, 2250003 (2022). Link, Web of Science, Google Scholar
- 17. Sutter Instrument, “Movable Objective Microscope,” https://www.sutter.com/MICROSCOPES/mom.html. Google Scholar
- 18. , “Deep-brain three-photon imaging enabled by aggregation-induced emission luminogens with near-infrared-III excitation,” ACS Nano 16, 6712–6724 (2022). Crossref, Web of Science, Google Scholar
- 19. , “In Vivo 3-photon fluorescence imaging of mouse subcortical vasculature labeled by AIEgen before and after craniotomy,” Adv. Funct. Mater. 32, 2205151 (2022). Crossref, Web of Science, Google Scholar
- 20. , Paxinos and Franklin’s the Mouse Brain in Stereotaxic Coordinates, Academic Press (2019). Google Scholar
- 21. , “A cell atlas for the mouse brain,” Front. Neuroinf. 12, 84 (2018). Crossref, Web of Science, Google Scholar
- 22. , Handbook of Biomedical Fluorescence, CRC Press (2003). Crossref, Google Scholar
- 23. , “Monte Carlo simulation of multiphoton fluorescence microscopic imaging through inhomogeneous tissuelike turbid media,” J. Biomed. Opt. 8, 440–449 (2003). Crossref, Web of Science, Google Scholar
- 24. , “Two-photon microscopy in brain tissue: Parameters influencing the imaging depth,” J. Neurosci. Meth. 111, 29–37 (2001). Crossref, Web of Science, Google Scholar
- 25. , “Quantitative assessment of skin layers absorption and skin reflectance spectra simulation in the visible and near-infrared spectral regions,” Physiol. Meas. 23, 741 (2002). Crossref, Web of Science, Google Scholar
- 26. C. Mätzler, “MATLAB functions for Mie scattering and absorption Version 2,” Research Report No. 2002-11, Institut für Angewandte Physik (2002). Google Scholar
- 27. S. L. Jacques, “Simulation of fluorescence in scattering medium,” mcsubfluor.c, https://omlc.org/software/mc/mcfluor/index.html. Google Scholar
- 28. , “Diffuse reflectance from a finite blood medium: Applications to the modeling of fiber optic catheters,” Appl. Opt. 15, 2059–2067 (1976). Crossref, Web of Science, Google Scholar

