A novel -ketoamide reactivity-based two-photon fluorogenic probe for visualizing peroxynitrite in Parkinson’s disease models
Abstract
Peroxynitrite (ONOO contributes to oxidative stress and neurodegeneration in Parkinson’s disease (PD). Developing a peroxynitrite probe would enable in situ visualization of the overwhelming ONOO− flux and understanding of the ONOO− stress-induced neuropathology of PD. Herein, a novel -ketoamide-based fluorogenic probe ( DFlu) was designed for ONOO− monitoring in multiple PD models. The results demonstrated that DFlu exhibits a fluorescence turn-on response to ONOO− with high specificity and sensitivity. The efficacy of DFlu for intracellular ONOO− imaging was demonstrated systematically. The results showed that DFlu can successfully visualize endogenous and exogenous ONOO− in cells derived from chemical and biochemical routes. More importantly, the two-photon excitation ability of DFlu has been well demonstrated by monitoring exogenous/endogenous ONOO− production and scavenging in live zebrafish PD models. This work provides a reliable and promising -ketoamide-based optical tool for identifying variations of ONOO− in PD models.
1. Introduction
Parkinson’s disease (PD) is a common neurodegenerative disorder with a high incidence in people over 65.1,2,3 The functional loss of dopaminergic neurons in the substantia nigra is considered as the pathogenesis of PD.4,5 Despite great efforts in the last few decades, it is difficult to insight the pathway of the loss of dopaminergic neurons.6,7,8 Recent evidence indicates that abnormal levels of reactive oxygen species (ROS) can cause oxidative stress and induce DA neuronal degeneration during the pathogenesis of PD.9,10 In addition, ROS overproduction is closely relative to other PD pathogenic factors, including mitochondrial dysfunction, inflammation and metal dyshomeostasis.11,12 Therefore, exploring the role of elevated ROS level-induced neurotoxicity in PD is beneficial for early diagnosis and treatment.
Peroxynitrite (ONOO, a common ROS, is produced via the diffusion-limited coupling superoxide radical (O and radical nitric oxide (NO.13 Normal concentrations of ONOO− can maintain the redox balance and act as secondary messengers to regulate several pivotal signal-transduction pathways in cells.14 On the contrary, excess ONOO− levels can lead to oxidative stress because of the strong oxidizing and nitrification ability in living biological systems.15 Under such oxidative stress, lipids, nucleic acids, enzymes and proteins were changed in structure and function.16 Ultimately, the disorders of biomolecular function result in severe PD disease.17,18,19 From this point of view, ONOO− can be used as a PD biomarker. Thus, developing forceful tools to monitor the levels of ONOO− is beneficial for understanding the relationship between PD and ONOO− and for early diagnosis of PD.
At present, some methods have been exploited to detect ONOO− including electrochemical, electron spin resonance, liquid chromatography-mass spectrometry and fluorescence approaches.20 Compared to the other techniques, fluorogenic probe-based detection are noninvasive and sensitive, which is ideal for monitoring ONOO− levels in biological systems.21,22,23,24,25 Consequently, many ONOO− fluorogenic probes have been exploited relying on different recognition moieties, such as aryl boronic, aryl borate ester, N-aminophenol, trifluorocarbonyl, -ketoamide and so on.18,26,27,28 Among them, -ketoamide has been widely used to detect the ONOO− levels in cardiovascular and hepatotoxicity disease models via combined inhibition of internal charge transfer (ICT) and photo-induced electron transfer (PET).29 However, the -ketoamide-based ONOO− fluorescence probe to track ONOO− fluctuations in the PD model has not been reported. Moreover, the existing -ketoamide-based ONOO− fluorescence probes utilize aryl dicarbonyl which contains an electron-withdrawing substituent (−NO2 or −CN) to increase the activity of -ketoamide reaction with ONOO−.30 As the reactivity increases, other reactive species may interfere with the selective detection of ONOO−, including H2O2 and ClO−, which limits its application.31,32 Therefore, developing a novel -ketoamide-based recognition moiety with excellent selectivity toward ONOO− in PD model remains a challenge.
In this work, we designed a new -ketoamide recognized group without 4-nitrophenyl aryl dicarbonyl construction unit to detect ONOO−. Moreover, given the advantages of two-photon imaging technology in monitoring abnormal ROS-level in vivo models associated with PD models (Table S1), we employed naphthylamine ketone ( Flu) as the two-photon fluorophore owing to its desirable two-photon action cross-section.17,18,33,34,35,36,37,38,39 Ultimately, a non4-nitrophenyl aryl dicarbonyl -ketoamide reactivity-based two-photon ONOO− fluorogenic probe ( DFlu) was developed. The systematical investigation of photophysical properties demonstrated that the DFlu possesses excellent selectivity and suitable two-photon fluorescence intensity towards ONOO−. In vitro experiments further proved that DFlu is able to sensitively visualize and monitor the dynamic changes of ONOO−. Moreover, manipulation of ONOO− levels in adult zebrafish could also be observed by two-photon imaging. These results might guide designing novel two-photon probes for ONOO− in multiple PD models.
2. Materials and Methods
2.1. Materials and instrumentation
All chemical reaction and cell imaging reagents were obtained from internet medicine suppliers without further purification unless otherwise noted. The progress in the chemical reaction and column chromatography was surveilled with thin-layer chromatography (TLC) on precoated silica plates (250m thickness), and the spots were observed with UV light. The nuclear magnetic resonance was recorded in Bruker ADVANCE NEO 500 spectrometer using CDCl3 or -DMSO at room temperature. U-3900H and F-7100, respectively, collected absorption and fluorescence data. High-performance liquid chromatography (HPLC) was performed on UltiMate 3000. A high-resolution mass spectrum was obtained by Micromass GCT-MS (ESI source).
2.2. Preparation and Characterization
1-(6-hydroxynaphthalen-2-yl)ethan-1-one ( A1) and 1-(6-(methylamino)naphthalen-2-yl)ethan-1-one ( Flu) were detailed described in detail in the experimental section of Supplementary Material. The date of 1H NMR and C NMR were shown in the Supporting Information.
2.2.1. Preparation of 1-methyl-2,3-dioxo-2,3-dihydro-1H-benzo[f]indole-6-carbonitrile (SFlu)
Oxalyl chloride (85.6L, 1 mmol) was added into 25 mL three-neck flask containing dry tetrahydrofuran (10mL) in a nitrogen atmosphere. Subsequently, Flu (0.20g, 1.00mmol) was added dropwise and kept stirring for 4h at 37∘C. The product was collected by filtration to obtain red powder SFlu (0.21g, 85%). 1H NMR (500MHz, -DMSO) (ppm): 8.71 (s, 1H), 8.56 (d, J = 8.7Hz, 1H), 8.48 (d, J = 8.7Hz, 1H), 8.16 (d, J = 8.8Hz, 1H), 7.62 (d, J = 8.7Hz, 1H), 3.24 (s, 3H), 2.69 (s, 3H). C NMR (126MHz, -DMSO) (ppm): 196.4, 182.3, 160.1, 157.6, 140.4, 133.4, 132.2, 130.9, 128.4, 121.9, 111.7, 108.3, 27.0, 26.7. [M+H]: calculated for 254.07, found 254.26.
2.2.2. Preparation of N,N-bis(6-acetylnaphthalen-2-yl)-N1,N2-dimethyloxalamide (DFlu)
Flu (0.20g, 1.00mmol) and K2CO3(0.70g, 5.00mmol) were added into 25mL three-neck flask containing dry tetrahydrofuran (10mL) at ice bath conditions. After stirring for 10min, oxalyl chloride (42.8L, 0.50mmol) was added dropwise at 0∘C. Then, the white suspension was observed and stirred at room temperature for 4h. Using filtration, the product was obtained as a white powder (0.20g, 90%). 1H NMR (500MHz, CDCl3) (ppm): 8.51 (s, 2H), 8.11 (dd, J = 8.6, 1.7Hz, 2H), 7.87 (d, J = 8.7Hz, 2H), 7.70 (d, J = 8.5Hz, 2H), 7.17 (d, J = 2.2Hz, 2H), 6.90 (dd, J = 8.7, 2.2Hz, 2H), 3.10 (s, 6H), 2.79 (s, 6H). C NMR (126MHz, CDCl3) (ppm): 197.8, 164.8, 140.2,135.3, 131.2, 130.5, 129.6, 128.4, 125.3, 124.5, 123.7, 35.5, 26.8. [M+H]: calculated for 453.1736, found 453.1819.
2.3. Absorption and fluorescence measurements
The absorption and fluorescence were tested in phosphate buffer ( PBS). SFlu and DFlu (1mM) were dissolved in DMSO. The ion and amino acid (10mM) was dissolved in deionized water. The fluorescence data were collected at 350nm excitation wavelength with a 5nm slit. A cytation 5 microplate reader recorded the stable response of the probe at different temperatures and pH.
2.4. Cell culture and imaging
SH-SY5Y cells were cultured in Dulbecco’s modified medium (DMEM) containing 100 units/mL penicillin, 10% fetal bovine serum and 100g/mL streptomycin. When the cell density reaches 60–70% and maintains exponential growth, it is needed in several confocal dishes, and the cell density is observed to be around 60%. The cells are treated for imaging according to the requirements of different groups.
3-morpholinosydnonimine hydrochloride (SIN-1, 500M) was used to treat cells for 1h at 37∘C with or without the 4h pretreatment of uric acid (UA, ONOO− scavenger, 200M) to image exogenous ONOO−. To image endogenous ONOO− in PD models, 1-Methyl-4-Phenylpyridinium ion (500M) was applied to the cells for 4h at 37∘C with or without 4h pretreatment of 200M UA. Subsequently, the cells were incubated with 10M DFlu for 1h at 37∘C, rinsed with PBS and imaged with Nikon confocal microscope.
2.5. Zebrafish culture and imaging
For exogenous ONOO− imaging, the five-day-old zebrafish were treated with 1mM SIN-1 for 1h with or without 4h pretreatment of 500M UA. For endogenous ONOO− imaging in PD models, the zebrafish were treated with 3mM MPP for 2h with or without 4h pretreatment of 500M UA. Subsequently, DFlu were incubated for 3h with zebrafish, rinsed with PBS and anesthetized with 0.01–0.02% tricaine prior to imaging. Zeiss LSM880 NLO Confocal Microscope was used for the imaging collection.
2.6. Statistical analysis
GraphPad Prism (GraphPad Software, San Diego, CA) was used to analyze all the experimental data. Normally distributed datasets were compared using a one-way ANOVA followed by Dunnet’s post-hoc test where appropriate. A value of ≤ 0.05 was considered statistically significant. Data were expressed as mean ± SD.
3. Results and Discussion
3.1. Design and synthesis
To achieve high ONOO− selectivity, avoid autofluorescence interference and diminish light damage in living PD models during imaging, we chose the dicarbonyl group instead of aryldicarbonyl with a strong electron-withdrawing. Moreover, we utilize Flu as a two-photon-based fluorophore. DFlu was synthesized via the Stollé synthesis reaction between aldehyde oxalyl chloride and Flu. In the synthesis process, we found an interesting phenomenon: Oxalyl chloride is added in different orders to get different products ( DFlu or SFlu), but both products contain -ketoamide reactivity-based ONOO− recognition groups. To our best knowledge, the amide bond of the -ketoamide group could be broken after reacting with nucleophilic ONOO− and then resulting in the change in fluorescence signals of SFlu and DFlu. Therefore, with the help of the fluorescence imaging technique can detect the dynamic changes of ONOO− in PD models. The detailed synthetic route is shown in Fig. S1. These compounds were well-validated through 1H NMR, C NMR and mass spectrometry.
3.2. Spectroscopic response of probe to ONOO−
The absorption spectra were first employed to determine the optimal reaction conditions between ONOO− and the probe to confirm the molecular design concept. The absorption spectra of SFlu and DFlu in different solvents were shown in Figs. S2 and S3, respectively. The absorption wavelength of DFlu was obviously changed only in DMSO because DMSO as an aprotic solvent may inhibit the generation of hydrogen bonds and improve the solubility of DFlu (Fig. S3).40 Furthermore, the absorption spectra of SFlu and DFlu in the PBS/DMSO mixture solvent were tested (Figs. S4 and S5). When the ratios of DMSO and PBS are 8:2, the presence of 40M ONOO− modifies the absorption spectra of SFlu and DFlu dramatically. We next investigated the alteration in the absorption spectrum of SFlu and DFlu with various concentrations of ONOO− in the PBS/DMSO mixture solvent. As depicted in Fig. 1(a), the absorption spectra of DFlu gradually occurred as a new peak at 360nm accompanied by the peak decline at 300nm with a clear isosbestic point of 313nm. In contrast, the absorption spectra of SFlu exhibited a noticeable hypochromic effect at 488nm and a blue shift ranging from 480nm to 412nm [Fig. 1(b)]. The fluorescence titration experiments were shown in Fig. 1(b), and it demonstrated that DFlu displayed an apparent fluorescence turn-on changes at 490nm. On the other hand, SFlu showed a fluorescence turn-off in the existance of ONOO− [Fig. 1(d)]. In order to reduce the background interference of the biological environment, the turn-on of fluorescence intensity of DFlu was selected for subsequent experiments.
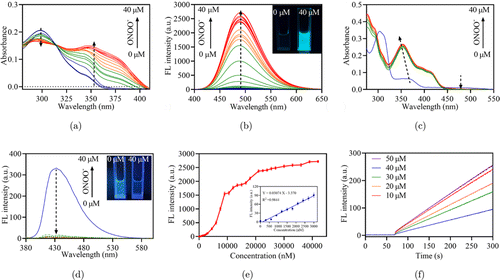
Fig. 1. (a) Absorption and (b) fluorescence spectra of DFlu (10M) toward various concentrations of ONOO− ( = 350nm). (c) Absorption and (d) fluorescence spectra of SFlu (10M) with various concentrations of ONOO− ( = 365nm). (e) The emission intensity change at 490nm at the different concentrations of ONOO−. Inset linear fitting curve of fluorescence intensity with different concentrations of ONOO− from 0 to 3000nM. = 350nm, data represent mean ± SD (). (f) Fluorescence response of DFlu with the addition of ONOO−. ONOO− was added at 60s and fluorescence intensity at 490nm was measured with excitation at 350nm.
We next investigated the sensitivity of DFlu for ONOO−. In Fig. 1(e), the peak intensity at 490nm increased gradually with increasing content of ONOO− and the detection limit of DFlu was calculated to be 9.89nM. The rate constant of the reaction between the DFlu and ONOO− was further evaluated (k = 0.0282min at 37∘C, Fig. S6 and Table S2), which is slower than that of -ketoamide with strong electron absorption.29 However, the change of fluorescence signal of DFlu is obvious after reacting with ONOO− [Fig. 1(f)]. In addition, the DFlu and ONOO− reaction also had a yield of 64% (Fig. S7). These results indicated that DFlu is considered a powerful imaging tool to monitor ONOO− in the living system at low concentrations.
3.3. Selective and stable response of DFlu towards ONOO−
To test the specificity against ONOO−, DFlu was tested with different anions (HCO; F−; I−; Br−; NO; CO; SO, cations (Mg; Al; Cu, Fe; Mn; Zn; Ni, amino acids (Glycine; Alanine; Valine; Methionine; Proline; Serine; Tyrosine; Histidine) and ROS (ONOO−; ROO−; 1O2; ⋅OH; ClO−; H2O. As shown in Fig. 2(a), ONOO− was the only substance that enhanced the fluorescence of DFlu. In addition, the competitive experiments manifested that the fluorescence response of DFlu to ONOO− was not affected by other phycological substances [Fig. 2(b)]. Considering that ONOO− probes frequently cross-reacted with H2O2 due to their similar reactivity and peroxide moiety, high level of H2O2 was added to DFlu solution [Figs. 2(c) and 2(d)]. Inspiringly, no fluorescence increase was seen in the presence of 500M H2O2. Moreover, in the presence of biologically relevant reducing agents (GSH or CO, ONOO−-dependent reactions are often altered.41 ONOO− can be rapidly reduced by reductive reagents such as GSH and CO2 which results in its short lifetime. However, DFlu is still able to detect ONOO− in a relatively short time [Figs. S8(a) and 8(b)], and as shown in Figs. S8(c) and 8(d), DFlu exhibited high sensitivity in the presence of high concentrations of GSH (100M) and CO2 (12mM), respectively. On the basis of these results, DFlu could selectively identify ONOO−.42,43
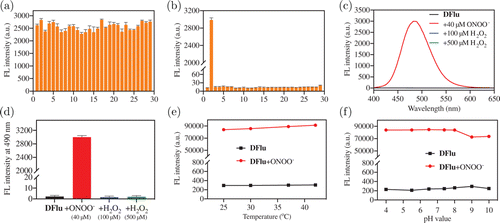
Fig. 2. (a) The fluorescence response of DFlu to various 1–29 substances: Blank; ONOO−; ROO−; 1O2; ⋅OH; ClO−; H2O2; Mg; Al; Cu; Fe; Mn; Zn; Ni; HCO; F−; I−; Br−; NO3−; CO; SO; Glycine; Alanine; Valine; Methionine; Proline; Serine; Tyrosine; Histidine. (b) Fluorescence intensity of DFlu reacting with ONOO− in the existence of 28 substances. = 350nm, = 490nm, data represent mean ± SD (); (c) Fluorescence responses and (d) the columns plot of DFlu incubated with blank, H2O2 (100M), H2O2 (500M) and ONOO− (40M). The fluorescence intensity changes of 10M DFlu reaction with 40M ONOO− at (e) different temperatures and (f) different pH.
In light of DFlu excellent anti-interference performance against ONOO−, we further explore whether other biological environments, like temperature and pH, would affect the response signals. In Fig. 2(e), in the presence of 40M ONOO−, the DFlu fluorescence intensity did not change significantly between 25∘C and 45∘C, indicating that DFlu monitoring ONOO− was not affected by temperature. Additionally, as shown in Fig. 2(f), DFlu exhibited weak fluorescence in the pH ranges from 4 to 10 without ONOO−, and strong fluorescence intensity with ONOO− in pH of 6–8. The above results indicated that DFlu is suitable for detecting ONOO− in physiologically relevant conditions.
3.4. Sensing mechanism of DFlu towards ONOO−
Next, the mechanism of fluorescence signal activation of DFu was studied from both experimental and theoretical aspects. Firstly, the reaction between DFlu and ONOO− was confirmed by HPLC. The results displayed that the Flu (Rt = 3.34min) was the main product after DFlu reacted with ONOO− [Fig. 3(a)]. In Fig. S6, high-resolution mass spectrometry (HR-MS) analysis further confirmed that the reaction produced Flu () is consistent with Scheme S1.
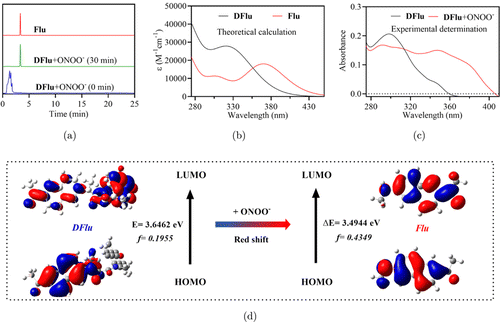
Fig. 3. (a) The HPLC changes of DFlu reacting with ONOO− for 30min. (b) The theoretical TDDFT absorption peak DFlu and Flu; (c) The experimental absorption peak of DFlu with and without ONOO−; (d) The DFT optimization of the structures and frontier molecular orbitals for DFlu and Flu.
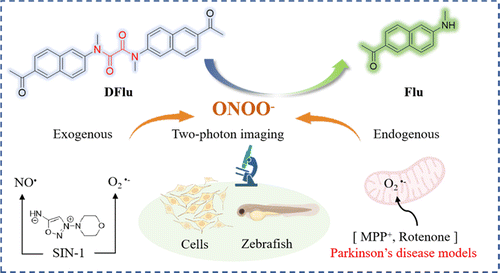
Scheme 1. Chemical structures and schematic illustration of DFlu for ONOO− detection in PD models (created with http://BioRender.com).
In order to further clarify the DFlu sensing mechanism, theoretical studies were conducted utilizing time-dependent DFT (TD-DFT) calculations at the B3LYP/6-31G ( level using Gaussian 09. The results indicated that DFlu and Flu exhibited characteristic absorption peaks at 317nm and 360nm, respectively, which corresponded to experimental peaks at 345nm and 354nm [Figs. 3(b) and 3(c)]. In addition, the oscillator strengths ( of Flu () is higher than DFlu (), which corresponded to the high molar absorption coefficients of Flu compared to DFlu in Table S3. Moreover, the frontier molecular orbitals play crucial roles in the electronic transition. As shown in Fig. 3(d), the electrons of the highest occupied molecular orbital (HOMO) and the lowest unoccupied molecular orbital (LUMO) were independently distributed at the ends of DFlu, implying that the amide bonds have suppressed the push–pull electron effect of DFlu. Conversely, the electrons on HOMO and LUMO were mainly distributed throughout the entire molecule, which indicated the amide bond was cleaved and produced Flu with a strong fluorescence signal due to the recovery of ICT. Furthermore, as shown in Table S3 and Fig. S9, the high quantum yield (0.918) and emission wavelength redshift with increasing polarity of Flu also shows that the strong fluorescence originates from the nature of ICT. Moreover, the HOMO–LUMO energy gap was 3.6462–3.4944eV, which is consistent with the apparent redshift in the absorption spectrum after reactions between DFlu reacting with ONOO−.
3.5. The imaging of ONOO− in living cells
Based on the excellent fluorescent response of DFlu to ONOO−, we attempted to utilize DFlu to visualize the ONOO− in living cells. Before cell imaging, we evaluated the cytotoxicity of different DFlu concentrations. After being treated with 20M DFlu for 24h, the viability of SH-SY5Y cells and RAW 264.7 cells remained above 80% (Fig. S10). Next, DFlu was employed to monitor the exogenous and endogenous ONOO−. For the exogenous ONOO− imaging, we stimulated SH-SY5Y cells with SIN-1 (ONOO− donor). As shown in Figs. 4(a) and 4(b), no fluorescence signals were observed in DFlu-treated cells. However, the cells exhibited significant fluorescence increase SIN-1 stimulation. After being pretreated with UA (ONOO− scavenger), the fluorescence signal intensity induced by SIN-1 was distinctly diminished. These results reveal that DFlu possesses the capability to monitor exogenous ONOO−.
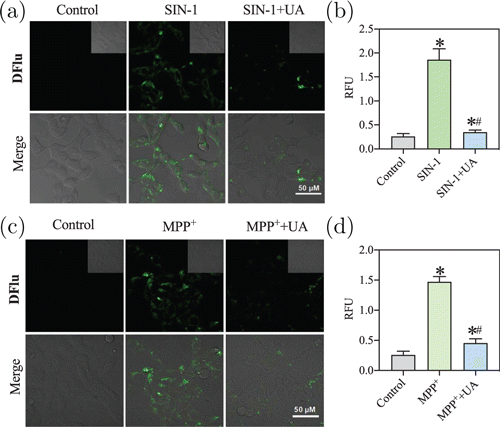
Fig. 4. Confocal bioimaging of ONOO− levels. (a) and (c) Representative images of SH-SY5Y cells treated with DFlu (10M, 1h) after SIN-1 or MPP treatment. Scale bar = 50m. nm, –570nm. (b) and (d) The fluorescence intensity was quantified and the data were expressed as mean ± SD (). versus control, versus SIN-1 or MPP.
Furthermore, we used MPP, an acute clinical parkinsonism inductive agent, to reveal the variation of ONOO− in PD disease at the cellular level.44 After treating with MPP for 8h, a noticeable boost in fluorescence intensity was observed [Fig. 4(c)]. Meanwhile, when a combination of MPP and UA was used to treat cells, no remarkable increased fluorescence was observed [Fig. 4(d)]. In addition, we also used DFlu to monitor ONOO− levels in rotenone-induced PD models and obtained the same fluorescence imaging results (Fig. S11). Moreover, we observed that the ONOO− levels were slightly lower in the rotenone-induced PD model than in the MPP-induced PD model. Meanwhile, DFlu successfully detected excessive ONOO− levels in inflammatory models (Fig. S12). These results further proved that DFlu could detect the exogenous and endogenous ONOO− levels in vitro and serve as a promising molecular imaging tool to visualize abnormal ONOO− levels under pathological conditions.
3.6. The imaging of ONOO− in zebrafish
Encouraged by the capability of the probe to visualize exogenous/endogenous ONOO− and the excellent two-photon properties of the product ( Flu) after the reaction between DFlu and ONOO− (Fig. S13), we further investigated whether DFlu could be applied for visualizing ONOO− levels in vivo by two-photon confocal microscope. As shown in Figs. 5(a) and 5(b), the SIN-1 treated zebrafish using exogenous ONOO− models exhibited strong TP fluorescence compared to the control and SIN-1+UA groups. Moreover, the MPP-treated zebrafish were used as PD disease models. As shown in Figs. 5(c) and 5(d), strong red two-photon fluorescence was observed when the MPP-treated zebrafish was incubated with DFlu for 3h. Furthermore, the recorded fluorescence signal decreased significantly in the presence of UA. In addition, the same results were obtained in the zebrafish model of PD induced by rotenone (Fig. S14). These results demonstrated that DFlu could accurately discriminate the area with high levels of ONOO− in the zebrafish PD model.
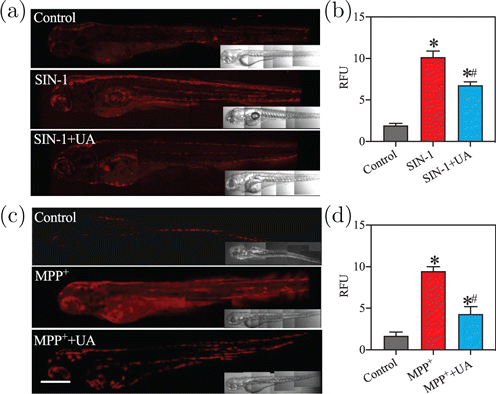
Fig. 5. Two-photon fluorescence bioimaging of ONOO− levels in zebrafish. (a) and (c) Representative images of living zebrafish upon incubation with DFlu (10M, 3h) after SIN-1 or MPP treatment. Scale bar = 200m, nm, –500nm. (b) and (d) The fluorescence intensity was quantified and the data were expressed as mean ± SD (). versus control, versus SIN-1 or MPP.
4. Conclusion
In conclusion, we developed novel -ketoamide recognition moieties and used it to construct a two-photon peroxynitrite probe ( DFlu). The conspicuous fluorescence of DFlu at 490 nm was observed to be stimulated by ONOO− and the theoretical calculation showed strong fluorescence from the recovery of ICT capacity. DFlu exhibited good stability and excellent selectivity in the presence of other reactive substances. In addition, DFlu could detect exogenous and endogenous ONOO− in living cells with negligible cytotoxicity. More importantly, DFlu could detect endogenous/exogenous ONOO− in PD zebrafish models by two-photon imaging. These results could guide the design of the probe’s red-shifting absorption and emission based on push and pull electrons and could promote a new way to construct -ketoamide-based two-photon ONOO− probes for the in-depth study of ONOO− stress-related diseases.
Conflict of Interest
The authors declare that there are no conficts of interest relevant to this article.
Acknowledgments
This work was financially supported by the National Natural Science Foundation of China (22077101), the Open Project Program of Wuhan National Laboratory for Optoelectronics (No. 2020WNLOKF023), Natural Science Foundation of Shaanxi Province (2022JM-130), the Joint Research Funds of Department of Science & Technology of Shaanxi Province and Northwestern Polytechnical University (2020GXLH-Z-008, 2020GXLH-Z-021, 2020GXLH-Z-023), the China Postdoctoral Science Foundation (2022M711595, 2022M722595), Postdoctoral Research Funding Schemes of Jiangsu Province (2021K036A), The Natural Science Foundation of Ningbo (202003N4049, 202003N4065). Tao Shao and Xianning Xu contributed equally to this work.
References
- 1. , “Parkinson’s disease: Mechanisms and models,” Neuron 39, 889–909 (2003). Crossref, Web of Science, Google Scholar
- 2. , “Fluorescent probes for bioimaging of potential biomarkers in Parkinson’s disease,” Chem. Soc. Rev. 50, 1219–1250 (2021). Crossref, Web of Science, Google Scholar
- 3. , “A review of quality of life after predictive testing for and earlier identification of neurodegenerative diseases,” Prog. Neurobiol. 110, 2–28 (2013). Crossref, Web of Science, Google Scholar
- 4. , “Parkinson disease,” Nat. Rev. Dis. Primers 3, 17013 (2017). Crossref, Web of Science, Google Scholar
- 5. , “Understanding the molecular causes of Parkinson’s disease,” Trends Mol. Med. 12, 521–528 (2006). Crossref, Web of Science, Google Scholar
- 6. , “Diagnosis and treatment of Parkinson disease: A review,” JAMA 323, 548–560 (2020). Crossref, Web of Science, Google Scholar
- 7. , “Parkinson’s disease,” Med. Clin. North Am. 103, 337–350 (2019). Crossref, Web of Science, Google Scholar
- 8. , “An update on medical and surgical treatments of parkinson’s disease,” Aging Dis 12, 1021–1035 (2021). Crossref, Web of Science, Google Scholar
- 9. , “The sources of reactive oxygen species and its possible role in the pathogenesis of Parkinson’s disease,” Parkinson’s Dis. 2018, 9163040 (2018). Google Scholar
- 10. , “The role of oxidative stress in Parkinson’s disease,” Antioxidants 9, 597 (2020). Crossref, Web of Science, Google Scholar
- 11. , “Rational design of nanocarriers for mitochondria-targeted drug delivery,” Chin. Chem. Lett. 33, 4146–4156 (2022). Crossref, Web of Science, Google Scholar
- 12. , “Neurodegenerative diseases and oxidative stress,” Nat. Rev. Drug Discov. 3, 205–214 (2004). Crossref, Web of Science, Google Scholar
- 13. , “Recent advances and perspectives in reaction-based fluorescent probes for imaging peroxynitrite in biological systems,” Coord. Chem. Rev. 474, 214848 (2023). Crossref, Web of Science, Google Scholar
- 14. , “Activity-based fluorescence probes for pathophysiological peroxynitrite fluxes,” Coord. Chem. Rev. 454, 214356 (2022). Crossref, Web of Science, Google Scholar
- 15. , “G1-4A, a polysaccharide from tinospora cordifolia induces peroxynitrite dependent killer dendritic cell (KDC) activity against tumor cells,” Int. Immunopharmacol. 23, 480–488 (2014). Crossref, Web of Science, Google Scholar
- 16. , “When it comes to an end: Oxidative stress crosstalk with protein aggregation and neuroinflammation induce neurodegeneration,” Antioxidants 9, 740 (2020). Crossref, Web of Science, Google Scholar
- 17. , “A near-infrared fluorescent probe for ratiometric imaging peroxynitrite in Parkinson’s disease model,” Sens. Actuators B, Chem. 359, 131393 (2022). Crossref, Web of Science, Google Scholar
- 18. , “Ultrafast detection of peroxynitrite in Parkinson’s disease models using a near-infrared fluorescent probe,” Anal. Chem. 92, 4038–4045 (2020). Crossref, Web of Science, Google Scholar
- 19. , “Reaction-based luminescent probes for reactive sulfur, oxygen, and nitrogen species: Analytical techniques and recent progress,” Anal. Chem. 92, 309–326 (2020). Crossref, Web of Science, Google Scholar
- 20. , “Water-soluble cationic boronate probe based on coumarin imidazolium scaffold: Synthesis, characterization, and application to cellular peroxynitrite detection,” Free Radic. Biol. Med. 179, 34–46 (2022). Crossref, Web of Science, Google Scholar
- 21. , “New strategies for fluorescent probe design in medical diagnostic imaging,” Chem. Rev. 110, 2620–2640 (2010). Crossref, Web of Science, Google Scholar
- 22. , “An inherently kidney-targeting near-infrared fluorophore based probe for early detection of acute kidney injury,” Biosens. Bioelectron. 172, 112756 (2021). Crossref, Web of Science, Google Scholar
- 23. , “Multifunctional nanotheranostics for near infrared optical imaging-guided treatment of brain tumors,” Adv. Drug Deliv. Rev. 190, 114536 (2022). Crossref, Web of Science, Google Scholar
- 24. , “Recent advances in small molecular near-infrared fluorescence probes for a targeted diagnosis of the Alzheimer disease,” Analyst 147, 4701–4723 (2022). Crossref, Web of Science, Google Scholar
- 25. , “Advances in antioxidant nanomedicines for imaging and therapy of Alzheimer’s disease,” Antioxidants Redox Signal. (2022), https://doi.org/10.1089/ars.2022.0107. Web of Science, Google Scholar
- 26. , “Four-armed functional siloxane enables ratiometric unconventional fluorescence for the detection of ONOO−,” Sens. Actuat. B. Chem. 331, 129462 (2021). Crossref, Web of Science, Google Scholar
- 27. , “An ICT-based fluorescent probe for ratiometric monitoring the fluctuations of peroxynitrite in mitochondria,” Sens. Actuators B, Chem. 328, 129069 (2021). Crossref, Web of Science, Google Scholar
- 28. , “A novel highly selective fluorescent probe with new chalcone fluorophore for monitoring and imaging endogenous peroxynitrite in living cells and drug-damaged liver tissue,” Talanta 215, 120934 (2020). Crossref, Web of Science, Google Scholar
- 29. , “Investigation of drug-induced hepatotoxicity and its remediation pathway with reaction-based fluorescent probes,” Anal. Chem. 89, 7693–7700 (2017). Crossref, Web of Science, Google Scholar
- 30. , “Two-photon fluorescent probe for revealing drug-induced hepatotoxicity via mapping fluctuation of peroxynitrite,” Chem. Sci. 8, 4006–4011 (2017). Crossref, Web of Science, Google Scholar
- 31. , “Rational design of an -ketoamide-based near-infrared fluorescent probe specific for hydrogen peroxide in living systems,” Anal. Chem. 88, 8019–8025 (2016). Crossref, Web of Science, Google Scholar
- 32. , “Construction of a novel far-red fluorescence light-up probe for visualizing intracellular peroxynitrite,” Talanta 197, 431–435 (2019). Crossref, Web of Science, Google Scholar
- 33. , “A sensitive two-photon probe to selectively detect monoamine oxidase B activity in Parkinson’s disease models,” Nat. Commun. 5, 3276 (2014). Crossref, Web of Science, Google Scholar
- 34. , “A two-photon fluorescent probe for visualizing endoplasmic reticulum peroxynitrite in Parkinson’s disease models,” Sens. Actuators B, Chem. 328, 129003 (2021). Crossref, Web of Science, Google Scholar
- 35. , “Two-photon dual-channel fluorogenic probe for in situ imaging the mitochondrial H2S/viscosity in the brain of drosophila Parkinson’s disease model,” Chin. Chem. Lett. 31, 2903–2908 (2020). Crossref, Web of Science, Google Scholar
- 36. , “A targetable fluorescent probe for imaging hydrogen peroxide in the mitochondria of living cells,” J. Am. Chem. Soc. 130, 9638–9639 (2008). Crossref, Web of Science, Google Scholar
- 37. , “A novel fluorogenic probe for visualizing the hydrogen peroxide in Parkinson’s disease models,” J. Innov. Opt. Health Sci. 13, 2050013 (2020). Link, Web of Science, Google Scholar
- 38. , “A novel pyrimidine based deep-red fluorogenic probe for detecting hydrogen peroxide in Parkinson’s disease models,” Talanta 199, 628–633 (2019). Crossref, Web of Science, Google Scholar
- 39. , “A mitochondria-targeted two-photon fluorogenic probe for the dual-imaging of viscosity and H2O2 levels in Parkinson’s disease models,” J. Mater. Chem. B 7, 4243–4251 (2019). Crossref, Web of Science, Google Scholar
- 40. , “A fast detection of peroxynitrite in living cells,” Anal. Chim. Acta 1106, 96–102 (2020). Crossref, Web of Science, Google Scholar
- 41. , “Direct oxidation of boronates by peroxynitrite: Mechanism and implications in fluorescence imaging of peroxynitrite,” Free Rad. Biol. Med. 47, 1401–1407 (2009). Crossref, Web of Science, Google Scholar
- 42. , “Reversible near-infrared fluorescent probe introducing tellurium to mimetic glutathione peroxidase for monitoring the redox cycles between peroxynitrite and glutathione in vivo,” J. Am. Chem. Soc. 135, 7674–7680 (2013). Crossref, Web of Science, Google Scholar
- 43. , “A near-IR reversible fluorescent probe modulated by selenium for monitoring peroxynitrite and imaging in living cells,” J. Am. Chem. Soc. 133, 11030–11033 (2011). Crossref, Web of Science, Google Scholar
- 44. , “-synuclein amplifies cytoplasmic peroxide flux, oxidative stress provoked by mitochondrial inhibitors in CNS dopaminergic neurons in vivo,” Redox Biol. 37, 101695 (2020). Crossref, Web of Science, Google Scholar

