Skip main navigation
×
Cookies Notification
We use cookies on this site to enhance your user experience. By continuing to browse the site, you consent to the use of our cookies.
Learn More

|
System Upgrade on Tue, May 28th, 2024 at 2am (EDT)
Existing users will be able to log into the site and access content. However, E-commerce and registration of new users may not be available for up to 12 hours.For online purchase, please visit us again. Contact us at customercare@wspc.com for any enquiries.

Lectures in Climate Change: Volume 1
Our Warming Planet
Topics in Climate Dynamics
Pages: 444- Edited by:
- Cynthia Rosenzweig (NASA Goddard Institute for Space Studies, USA & Columbia University, USA),
- David Rind (NASA Goddard Institute for Space Studies, USA & Columbia University, USA),
- Andrew Lacis (NASA Goddard Institute for Space Studies, USA), and
- Danielle Manley (Columbia University, USA)
Purchase
Save for later
Item saved, go to cart
ISBN: 978-981-314-877-2 (hardcover)
USD 178.00
Add to cart
ISBN: 978-981-314-878-9 (softcover)
USD 98.00
Add to cart
ISBN: 978-981-314-880-2 (ebook)
USD 78.00
Add to cart
ISBN: 978-981-314-877-2 (hardcover)
Checkout
ISBN: 978-981-314-878-9 (softcover)
Checkout
ISBN: 978-981-314-880-2 (ebook)
Checkout

The processes and consequences of climate change are extremely heterogeneous, encompassing many different fields of study. Dr David Rind in his career at the NASA Goddard Institute for Space Studies and as a professor at Columbia University has had the opportunity to explore many of these subjects with colleagues from these diverse disciplines. It was therefore natural for the Lectures in Climate Change series to begin with his colleagues contributing lectures on their specific areas of expertise.
This first volume, entitled Our Warming Planet: Topics in Climate Dynamics, encompasses topics such as natural and anthropogenic climate forcing, climate modeling, radiation, clouds, atmospheric dynamics/storms, hydrology, clouds, the cryosphere, paleoclimate, sea level rise, agriculture, atmospheric chemistry, and climate change education. Included with this publication are downloadable PowerPoint slides of each lecture for students and teachers around the world to be better able to understand various aspects of climate change.
The lectures on climate change processes and consequences provide snapshots of the cutting-edge work being done to understand what may well be the greatest challenge of our time, in a form suitable for classroom presentation.
Sample Chapter(s)
Introduction (107 KB)
CLIMATE LECTURE 1: Explaining Climate (9,786 KB)
- Understanding Climate Change:
- Explaining Climate (Andrew Lacis)
- Global Change in Earth's Atmosphere: Natural and Anthropogenic Factors (Judith L Lean)
- Building a Climate Model (Gary Russell)
- Radiative Processes:
- Atmospheric Radiation (Valdar Oinas)
- The Role of Clouds in Climate (Anthony D Del Genio)
- Dynamical Responses:
- How Will Storms and the Storm Track Change: Extratropical Cyclones on a Warmer Earth (Walter A Robinson and James F Booth)
- The Relationship Between Recent Arctic Amplification and Extreme Mid-Latitude Weather (Judah Cohen)
- The Role of Global Warming in Altering the Frequency and Intensity of Tropical and Non-Tropical Cyclones (Timothy Eichler)
- Hydrologic Responses:
- Wisdom, Climate, and Water Resources (Robert Webb)
- Soil Moisture in the Climate System (Randal Koster)
- Projections of Future Drought (Jennifer Aminzade)
- Lightning and Climate Change (Colin Price)
- Polar Responses:
- Polar Sea Ice Coverage, Its Changes, and Its Broader Climate Impacts (Claire L Parkinson)
- Arctic Sea Ice and Its Role in Global Change (Jiping Liu and Radley M Horton)
- Antarctic Sea Ice and Global Warming (Douglas G Martinson)
- Paleocimate Perspective:
- The Importance of Understanding the Last Glacial Maximum for Climate Change (Dorothy Peteet)
- Climate Change Impacts:
- Impacts of Sea level Rise on Coastal Urban Areas (Vivien Gornitz)
- Climate Change Challenges to Agriculture, Food Security, and Health (Cynthia Rosenzweig and Daniel Hillel)
- Chemistry–Climate Interactions in a Changing Environment: Wildfire in the West and the US Warming Hole (Loretta J Mickley)
- Educational Perspective:
- The Educational Global Climate Model (EdGCM) (Mark A Chandler)
Free Access
FRONT MATTER
- Pages:i–xi
https://doi.org/10.1142/9789813148796_fmatter
Preview Abstract
The following sections are included:
- Acknowledgements
- Contents
- Introduction
Section 1 Understanding Climate Change
Free Access
CLIMATE LECTURE 1: Explaining Climate
- Pages:3–27
https://doi.org/10.1142/9789813148796_0001
Preview Abstract
Key Points and Key Components
It all begins with the Sun. The global-mean solar illumination of the Earth has been determined to be about 340 W/m2 of which about 100 W/m2 is reflected back to space. Hence, the Earth absorbs a global annual-mean 240 W/m2 of solar energy. This amount of energy is just sufficient to support a global-mean temperature of 255 K. However, the global-mean surface temperature of the Earth is known to be about 288 K, which implies that the Planck emission from the ground surface must be about 390 W/m2. It is this ‘missing energy’ circumstance that led Joseph Fourier to conclude back in 1824 that there must be an atmospheric greenhouse effect causing thermal heat energy to be radiated downward from the atmosphere in order to supply the additional heat energy needed at the ground surface. This is because in the absence of the greenhouse effect, 240 W/m2 of absorbed solar energy is not sufficient to sustain a surface temperature of 288 K…
No Access
CLIMATE LECTURE 2: Global Change in Earth’s Atmosphere: Natural and Anthropogenic Factors
- Pages:29–50
https://doi.org/10.1142/9789813148796_0002
Preview Abstract
Among many challenges, climate change research seeks to understand:
- how and why Earth’s atmosphere is changing,
- the extent to which observed changes are the consequence of human activity, such as the emission of carbon dioxide and other greenhouse gases, or of natural variations driven by, for example, the Sun or volcanoes,
- why Earth’s surface warmed barely, if at all, in the last decade,
- why the atmosphere just 20 km above the surface is cooling instead of warming,
- how Earth’s temperature might evolve in the 21st century,
- when — and whether — the ozone layer will recover from its two-decade decline due to chlorofluorocarbon depletion…
No Access
CLIMATE LECTURE 3: Building a Climate Model
- Pages:51–73
https://doi.org/10.1142/9789813148796_0003
Preview Abstract
Introduction
Climate, or the average of day-to-day weather, can be very different at various points on Earth. The local climate in the Arabian Desert is hot and dry, while that in the Amazon River basin is hot and humid with frequent rain. In upstate New York, the climate changes from being warm in the summer with sporadic rain to cold in the winter with sporadic snow. Hawaii, on the other hand, has a pleasant climate all year long. However, the day-to- day weather at all of these locations is much more variable. There can be dry days in the Amazon jungle, and rainy days in the Arabian Desert. There are some days in winter that are warmer than some days in summer. For further contrast, daylight in Antarctica lasts up to six months at a time with freezing cold day-in day-out. Can a climate model be built that can reproduce all of this complex behavior?
Section 2 Radiative Processes
No Access
CLIMATE LECTURE 4: Atmospheric Radiation
- Pages:77–101
https://doi.org/10.1142/9789813148796_0004
Preview Abstract
Key Points
Most basic are the near-daily measurements of surface air temperature at meteorological stations around the globe, some dating back to the 18th century. There are also precise measurements of the key atmospheric greenhouse gases (CO2, CH4, N2O, O3, CFCs) that are associated with fossil fuel burning and with other human industrial activities. Accurate monitoring of changes in solar irradiance and other radiative forcings that impact the climate system is likewise important. But these latter effects are small compared to the anthropogenic greenhouse gas forcings. The other important components of the scientific documentation of global climate change include field campaigns, theoretical studies, and laboratory analysis of climate-constituent radiative properties…
No Access
CLIMATE LECTURE 5: The Role of Clouds in Climate
- Pages:103–130
https://doi.org/10.1142/9789813148796_0005
Preview Abstract
Introduction
David Rind has played a central role in the science of the modeling of climate change. He was the scientific driving force behind the development and evaluation of the first Goddard Institute for Space Studies (GISS) global climate model (GCM), ‘Model II’ (Hansen et al., 1983). Model II was one of the three original GCMs whose projections of climate change in response to a doubling of CO2 concentration were the basis for the influential Charney Report that produced the first assessment of global climate sensitivity. David used Model II to pioneer the scientific field of climate dynamics, performing a broad range of investigations of processes controlling individual elements of the general circulation and how they changed over a wide range of past and potential future climates (e.g., Rind and Rossow, 1984; Rind, 1986, 1987). The defining characteristic of David’s papers is his unique talent for tracking down the myriad links and causal chains among different parts of the nonlinear climate system. Rather than viewing climate using a simple forcing-and-response paradigm, David showed that the global energy, water, and even momentum cycles are coupled via the general circulation and its transports…
Section 3 Dynamical Responses
No Access
CLIMATE LECTURE 6: How will Storms and the Storm Track Change: Extratropical Cyclones on a Warmer Earth
- Pages:133–154
https://doi.org/10.1142/9789813148796_0006
Preview Abstract
Storms, Storm Tracks, and Expected Changes with Global Warming
Extratropical cyclones are the familiar low-pressure systems that dominate day-to-day weather over much of the planet. These storms follow typical paths denoted as storm tracks. They are important weather makers, bringing rain, snow, and sometimes damaging winds, and they are the engines of the mid-latitude climate system, carrying heat, moisture, and momentum from the subtropics towards the poles. Rainfall in mid-latitudes concentrates along the storm tracks. How these storms will change with a changing climate is, therefore, a leading question for how the weather and climate will be different on a warmer Earth…
No Access
CLIMATE LECTURE 7: The Relationship Between Recent Arctic Amplification and Extreme Mid-latitude Weather
- Pages:155–175
https://doi.org/10.1142/9789813148796_0007
Preview Abstract
Introduction
Climate change and its impacts is one of the most important challenges facing our society. Throughout his career, David Rind has been a pioneer on this topic, publishing many papers on the topic of climate change from past climates, most notably ice ages to future climates with much greater greenhouse gas (GHG) concentrations than found presently in the Earth’s atmosphere. For example, David Rind’s seminal paper ‘The Dynamics of Warm and Cold Climates’ (Rind, 1986) explored the zonal mean properties of the Earth’s atmosphere under a range of past, present, and future cold and warm climates. Here, I present a short lecture on climate change, specifically how Arctic amplification (AA) might influence extreme weather in the mid-latitudes. David Rind did publish on polar amplification (e.g., ‘The Consequences of not Knowing Low- and High-Latitude Climate Sensitivity’, Rind, 2008) but not as it pertains to extreme weather; a topic that is still emerging. Still, I know that David is sensitive to our limitations to understand the climate and appreciates unexpected and mysterious twists and turns in the climate system.
No Access
CLIMATE LECTURE 8: The Role of Global Warming in Altering the Frequency and Intensity of Tropical and Non-Tropical Cyclones
- Pages:177–193
https://doi.org/10.1142/9789813148796_0008
Preview Abstract
Introduction
Over the last several decades, we have seen a rapid evolution in both global reanalysis datasets and climate models. In the 1970s and 1980s, models existed only with coarse spatial and temporal evolution. For example, when I first came to NASA GISS to work as a programmer, the GISS model was run on an 8° × 10° (Lat/Lon) grid, with output produced monthly. By the time I received my Ph.D. in 2000, the GISS GCM was being run on a 2° × 2.5° (Lat/Lon) grid, with daily output available. During my time at GISS (December 1987 to June 2001), the separation between climate and weather was quite clear. There were weather models (e.g. Nested Grid Model (NGM) and Global Forecast System (GFS)) and there were climate models. While weather models could be run at a higher resolution, the amount of computer power needed to run for more than a week real-time prevented their adaptation to climate problems. Appropriate climate model applications included only the most general aspects of the Atmospheric Circulation. Another limitation was that the older GISS model (and GCMs in general) was run with climatological sea-surface temperatures (SSTs) and later, with observed SSTs; the latter allowed for some rudimentary assessment of impacts of El Niño Southern Oscillation on the general circulation…
Section 4 Hydrologic Responses
No Access
CLIMATE LECTURE 9: Wisdom, Climate, and Water Resources
- Pages:197–213
https://doi.org/10.1142/9789813148796_0009
Preview Abstract
Introduction
David Rind’s legacy is not only that he did great science, that he is an intellectual mentor for an impressive number of very successful scientists, but that he is an inspirational role model of how to be scientist. He grew up in the shadow of Yankee Stadium, and being a devoted Yankees fan, I believe that he first observed an atmospheric breaking wave over those hallow grounds. I always wondered if this vision over Yankee Stadium inspired him to be such a preeminent atmospheric scientist. Before spending some time discussing some of his research examining how changes in climate could impact water resources, I first want to present what I will call David Rind’s Words of Wisdom (at least as I remember): (1) ‘Hit it with a sledge hammer’, (2) ‘Nobody complains when they get an “A”’, (3) ‘No one looks very smart when you argue with an idiot’, and (4) ‘I would pay someone to clean out my desk’.
No Access
CLIMATE LECTURE 10: Soil Moisture in the Climate System
- Pages:215–229
https://doi.org/10.1142/9789813148796_0010
Preview Abstract
Soil Moisture — Atmosphere Feedback
The moisture held within the top meter or two of soil is a very tiny fraction (less than 0.01%) of the Earth’s total water (Eagleson, 1970). Nevertheless, its presence at the interface of the land and atmosphere gives it inordinate importance in the context of climate variability. Simply put, soil moisture variations can help determine meteorological variations. Consider, for example, an anomalously high evapotranspiration rate induced by a high soil moisture content. The high evapotranspiration can lead to an anomalously cooled land surface and thus cooler air temperatures (Seneviratne et al., 2010), and it can also lead to modifications in the evolution of the boundary layer, with concomitant impacts on the generation of convective rainfall (Betts et al., 1994)…
No Access
CLIMATE LECTURE 11: Projections of Future Drought
- Pages:231–249
https://doi.org/10.1142/9789813148796_0011
Preview Abstract
The Definition of Drought
The Intergovernmental Panel on Climate Change (IPCC) reported widespread agreement among climate model projections on emerging patterns in the global hydrologic cycle in the 21st century, such as increased precipitation at high latitudes, decreased precipitation in the subtropics, and increases in the frequency of heavy precipitation events, all of which would lead to permanent changes in annual and seasonal runoff and groundwater recharge (IPCC, 2007, 2013). These changes in the hydrologic cycle could fundamentally alter the nature of drought and flooding in many regions. In areas that are currently using a large proportion of their available water resources, these changes could prove challenging…
No Access
CLIMATE LECTURE 12: Lightning and Climate Change
- Pages:251–270
https://doi.org/10.1142/9789813148796_0012
Preview Abstract
Introduction
Lightning is one of nature’s most beautiful and awesome sights. Yet it can also be extremely dangerous, presenting a major natural hazard in many different environments, from power utility companies, to civil aviation, to golfers, and more. Thousands of people are killed every year by lightning bolts, while tens of thousands are injured as well (Cooray, Cooray and Andrews, 2007). Lightning impacts both our daily commercial and recreational activities. In the United States alone, damages due to lightning strikes amounts to tens of millions of dollars annually (Curran, Holle and Lopez, 2000). In recent years, with great interest in renewable energy, wind turbines have become extremely vulnerable to lightning damage (Glushakow, 2007). Furthermore, most commercial airliners are struck about once a year by lightning; however, due to the protective metal skin, generally little damage is incurred. Tens of thousands of fires are also ignited by lightning every year, generally in temperate or high latitudes (e.g. Canada, Siberia, etc.) (Stocks et al., 2002). In such cases, tens of fires can be ignited locally on the same day as a storm passes through, causing major problems for fire crews and fire management. Hence, knowledge of how lightning activity may change as the Earth’s temperature changes is of critical importance and interest…
Section 5 Polar Responses
No Access
CLIMATE LECTURE 13: Polar Sea Ice Coverage, Its Changes, and Its Broader Climate Impacts
- Pages:273–294
https://doi.org/10.1142/9789813148796_0013
Preview Abstract
Introduction
Sea ice is a crucial component of the climate system in both polar regions, reflecting solar radiation back to space, hindering exchanges of heat, mass, and momentum between ocean and atmosphere, and having numerous other impacts both on climate and on polar ecosystems. In view of these impacts and the interconnectedness of the global climate system as a whole, David Rind early on recognized the potential importance of sea ice changes to latitudes far equatorward of where the sea ice is and led a study to quantify those changes (described below)…
No Access
CLIMATE LECTURE 14: Arctic Sea Ice and Its Role in Global Change
- Pages:295–307
https://doi.org/10.1142/9789813148796_0014
Preview Abstract
Introduction
Sea ice is an important component of the global climate system. Sea ice forms, grows, and melts in the ocean. Sea ice grows during the fall and winter and melts during the spring and summer. Sea ice can melt completely in summer or survive multiple years. Sea ice can be classified by stages of development (thickness and age), that is, first-year sea ice (ice thickness typically <1.8 m) and multiyear sea ice (ice thickness typically >1.8 m). Sea ice occurs in both hemispheres. In the Northern Hemisphere, sea ice develops in the Arctic Ocean and surrounding bodies including Hudson and Baffin Bay, Gulf of St. Lawrence, the Greenland Sea, the Bering Sea, and the Sea of Okhotsk (sea ice can be observed as far south as Bohai Bay, China, ∼38°N). In the Southern Hemisphere, sea ice only develops around Antarctica, reaching a maximum equatorward extension at around ∼55°S)…
No Access
CLIMATE LECTURE 15: Antarctic Sea Ice and Global Warming
- Pages:309–327
https://doi.org/10.1142/9789813148796_0015
Preview Abstract
Introduction
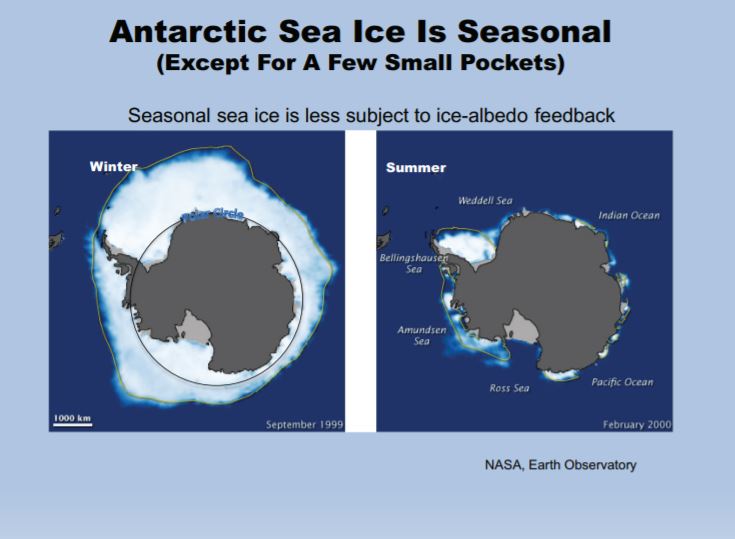
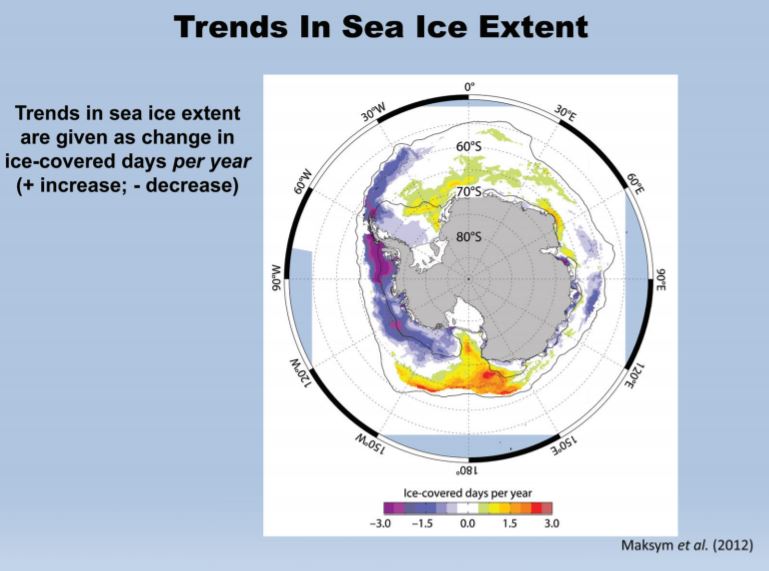
Currently, there is considerable focus on the inexplicable increasing trend in time of the average Antarctic sea ice extent (Parkinson and Cavalieri, 2012), often noted in the context of the rapidly decreasing Arctic sea ice cover. While the increasing Antarctic sea ice trend was originally considered small, Simmonds (2015) has recently shown that it cannot be considered small anymore. Unfortunately, the social media uses this Arctic–Antarctic comparison in an attempt to further emphasize the paradox of the increasing Antarctic sea ice cover (often to emphasize the failings of global warming ‘alarmists’), but such a comparison is unwarranted. The differences are so dramatic between the two poles that one is not justified in expecting the change in the Antarctic sea ice to echo that of the Arctic. For example, consider the geographic setting: the Arctic is a land-locked ocean that constrains the ice, whereas the Antarctic is a continent surrounded by ocean with primary winds blowing the ice floes to warmer waters where they rapidly melt. As a consequence, the Arctic until recently was largely covered by a relatively thick (∼3 m) perennial sea ice cover, whereas the Antarctic polar oceans are covered by a large thin (∼0.6 m) seasonal ice cover, with only small areas of perennial ice. Loss of Arctic highly reflective perennial ice in summer exposes the dark absorbing Arctic Ocean waters, driving the ice-albedo feedback and greatly enhancing the absorption of heat and enhanced melt back. In the Antarctic, the thin sea ice melts in spring, so the summer ocean water is always exposed, greatly limiting the ice-albedo feedback potential. But, even given these differences, we would still expect the Antarctic sea ice fields to decrease given a warming Earth…
Section 6 Paleocimate Perspective
No Access
CLIMATE LECTURE 16: The Importance of Understanding the Last Glacial Maximum for Climate Change
- Pages:331–348
https://doi.org/10.1142/9789813148796_0016
Preview Abstract
Introduction
The last glacial maximum (LGM) at approximately 23–18k (k—thousand calendar years) provides an important contrast to our present and pre-industrial climate in a warming world. Global observational datasets of LGM land and sea surface conditions have been synthesized and present some interesting challenges both for providing another scenario for understanding climate change and for climate sensitivity. These challenges are ongoing, as data increase and modeling improves. By definition, the LGM is defined as the time during the last glacial interval in which maximum ice was sequestered in ice sheets as visible in the marine isotopic records. Maximum cooling is visible from pollen and macrofossil records 14C dated to this interval, and ice sheets and alpine glaciers are roughly at their maximum extent throughout the globe. The ice cores extracted from Greenland and Antarctica have given us high-resolution records of greenhouse gases, dust, and isotopes of hydrogen and oxygen which reveal the progression out of the LGM at 18k as climate warmed…
Section 7 Climate Change Impacts
No Access
CLIMATE LECTURE 17: Impacts of Sea Level Rise on Coastal Urban Areas
- Pages:351–371
https://doi.org/10.1142/9789813148796_0017
Preview Abstract
Rising Seas and Coastal Hazards
Our planet is heating up largely because of increasing anthropogenic greenhouse gases from fossil fuel combustion and deforestation. Atmospheric levels of carbon dioxide and methane are now the highest in 800,000 years (Brook, 2008). Mean global temperature has increased by 0.7°C during the 20th century, likely surpassing temperatures of the past 1000 years (IPCC, 2013; Marcott et al., 2013)…
No Access
CLIMATE LECTURE 18: Climate Change Challenges to Agriculture, Food Security, and Health
- Pages:373–395
https://doi.org/10.1142/9789813148796_0018
Preview Abstract
We have learned from our brilliant and dedicated colleague, David Rind, that the already-evident and further-anticipated process of anthropogenic climate change raises worldwide concerns regarding agricultural production, food security, and public health. The four pillars of food security — its availability, accessibility, utilization, and stability — will all be affected by the expected changes in climate over the coming century. At both global and regional scales, the Intergovernmental Panel on Climate Change (IPCC) has demonstrated that the provision of food security and maintenance of ecosystem services are under threat from dangerous human interference in the Earth’s climate (Porter et al., 2014). The FAO emphasizes that the main cause of hunger and malnutrition is not the lack of food per se, but the inability of vulnerable groups to access food in many circumstances (FAO, 2014). Furthermore, the IPCC has determined that global food prices will likely increase by the year 2050 as a result of changes in temperature and precipitation (Porter et al., 2014; Nelson et al., 2014). At country scales, nations are concerned over potential damages that may arise in coming decades from climate change impacts on agriculture and the food system, as these are likely to affect their citizens’ well-being, regional planning, resource use, trading patterns, and international policies…
No Access
CLIMATE LECTURE 19: Chemistry–Climate Interactions in a Changing Environment: Wildfire in the West and the US Warming Hole
- Pages:397–408
https://doi.org/10.1142/9789813148796_0019
Preview Abstract
Introduction
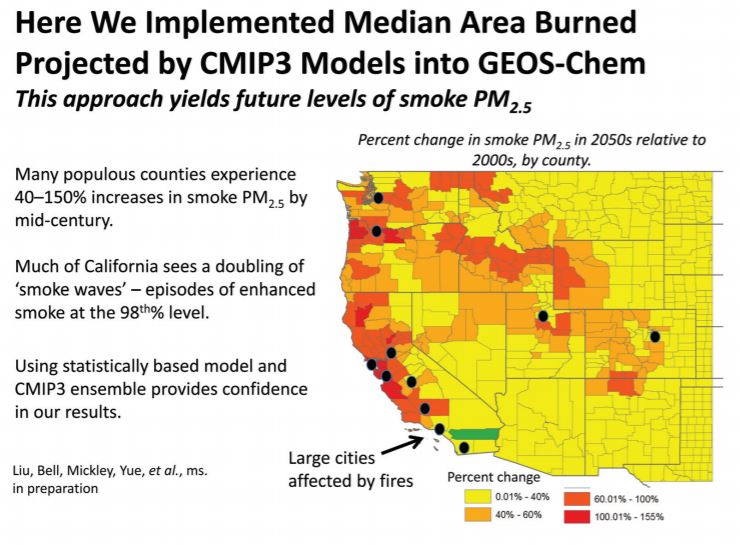
Tropospheric ozone and aerosols affect climate on both regional and hemispheric scales (Fiore et al., 2012, Unger, 2012). Climate change, in turn, influences the distribution and lifetimes of these species, with consequences for human health and ecosystems (Jacob and Winner, 2009). Understanding the coupling between short-lived chemical species and climate change is a major challenge, given the uncertainties in chemical mechanisms and climate processes. For example, aerosols perturb regional climate directly, through absorption and scattering of incoming sunlight, and indirectly, through interactions with cloud droplets. Neither the optical properties of the mix of aerosols in the atmosphere nor the details of cloud-aerosol interactions have been wellcharacterized (Rosenfeld et al., 2014; Chen et al., 2015)…
Section 8 Educational Perspective
No Access
CLIMATE LECTURE 20: The Educational Global Climate Model (EdGCM)
- Pages:411–428
https://doi.org/10.1142/9789813148796_0020
Preview Abstract
Introduction
Climate change will profoundly impact Earth’s environmental health as well as the world’s economic and geopolitical landscape over the coming decades. The impacts of climate change are, in fact, already beginning to be experienced and have the potential to affect every living plant and animal on Earth within decades (IPCC, 2014). Given this reality, every citizen of this planet should have the right to knowledge about the Earth’s climate system and have the option to adapt to, or help mitigate the profound changes that are coming. In addition, a portion of the workforce needs to be capable of interpreting and analyzing climate information because, since the impacts of climate change will be widespread, pervasive, and continue to change over time, more professions will be interacting with climate data. We are already at, or past, the point where educators and their students require access to the scientific and technological resources — computer models, data, and visualization tools — that scientists use daily in the study of climate change…
Free Access
BACK MATTER
- Pages:429–432
https://doi.org/10.1142/9789813148796_bmatter
Preview Abstract
The following sections are included:
- About the Editors
- Appendix — Supplementary Material

Cynthia Rosenzweig is a leader in the field of climate change impacts. She is a Senior Research Scientist at Columbia University's Center for Climate Systems Research and a professor in the Department of Environmental Science at Barnard College. She is also a senior research scientist at the NASA Goddard Institute for Space Studies, where she heads the Climate Impacts Group. She is the co-founder of the Agricultural Model Intercomparison and Improvement Project (AgMIP), a major international collaboration to improve global agricultural modeling, understand climate impacts on the agricultural sector, and enhance adaptation capacity in developing and developed countries. She is Co-Chair of the Urban Climate Change Research Network (UCCRN) and Co-Chair of the New York City Panel on Climate Change (NPCC). She was a coordinating lead author on observed climate change impacts for the IPCC Working Group II Fourth Assessment. She was named as one of Nature's "Ten People Who Mattered in 2012". A recipient of a Guggenheim Fellowship, she joins impact models with climate models to project future outcomes under altered climate conditions.

David Rind is a Senior NASA Climate Researchers Emeritus at the Goddard Institute for Space Studies. For more than 30 years he was a climate research scientist for NASA, as well as an adjunct professor at Columbia University, teaching graduate-level courses in climate dynamics and atmospheric dynamics. During this time he had the pleasure of working with a number of graduate students, as well as many close colleagues. He has more than 300 publications relating to climate and climate change, is a fellow of the American Geophysical Union, and a recipient of many awards, including the 2007 Nobel Peace Prize as a lead author on the Intergovermental Panel on Climate Change (IPCC).

Andrew Lacis (PhD in Physics from University of Iowa, 1970) is a senior research scientist at the NASA Goddard Institute for Space Studies (GISS) in New York City. Dr Lacis has been a member of the GISS climate modeling group since the mid-1970s. His area of expertise is development of fast and accurate radiative transfer techniques to model solar and thermal radiation with applications to the study of global climate change and the remote sensing of planetary atmospheres. He is a fellow of the American Geophysical Union, and is the principal architect of the radiation modeling methodology that is used in the general purpose GISS coupled atmosphere-ocean Global Climate Model (GCM).

Danielle Manley is a Staff Associate of Research at Columbia University's Center for Climate Systems Research (CCSR), where her primary role is in communicating climate risk information to stakeholders for local decision-making and resilience planning. She serves as a project manager for the New York City Panel on Climate Change (NPCC), She is a researcher for the Consortium for Climate Risk in the Urban Northeast, a NOAA-funded Regional Integrated Sciences and Assessments Program, as well as for the Adaptation for Development and Conservation (ADVANCE) partnership between CCSR and the World Wildlife Fund. She has a Bachelor's of Science in Environmental Science from the University at Buffalo, and a Master's Degree in Climate and Society from Columbia University.
Sample Chapter(s)
Introduction (107 KB)
CLIMATE LECTURE 1: Explaining Climate (9,786 KB)
Access to the following materials comes with the purchase of this book.
Powerpoint Slides (253 MB)
Please download the zip file to a permanent directory before you try to unzip and view the power point slides.
Online access is automatically assigned if you purchase the ebook online via www.worldscientific.com.
If you have purchased the print copy of this book or the ebook via other sales channels, please follow the instructions as stated in the book to access the supplementary materials.
Your access token would have been activated under your username when you purchased the ebook directly from WSPC website OR when you click on the URL activation link provided in the print or ebook. Hence, for subsequent access to the supplementary materials, please simply log in with the same username and you will be able to access.
For any enquiries on access issues, please email sales@wspc.com.sg.