A digital microfluidic single-cell manipulation system optimized by extending-depth-of-field device
Abstract
Microfluidic systems have been widely utilized in high-throughput biology analysis, but the difficulties in liquid manipulation and cell cultivation limit its application. This work has developed a new digital microfluidic (DMF) system for on-demand droplet control. By adopting an extending-depth-of-field (EDoF) phase modulator to the optical system, the entire depth of the microfluidic channel can be covered in one image without any refocusing process, ensuring that 95% of the particles in the droplet are captured within three shots together with shaking processes. With this system, suspension droplets are generated and droplets containing only one yeast cell can be recognized, then each single cell is cultured in the array of the chip. By observing their growth in cell numbers and the green fluorescence protein (GFP) production via fluorescence imaging, the single cell with the highest production can be identified. The results have proved the heterogeneity of yeast cells, and showed that the combined system can be applied for rapid single-cell sorting, cultivation, and analysis.
1. Introduction
When performing single-cell analysis like genotyping,1 antibiotic tolerance and persistence studies,2 nucleic acid amplification,3 and drug evaluations,4 to get rid of the complicated background in the normal cultivation environments, single cell should be isolated for further cultivation and mutation analysis by micromanipulation,5 laser capture microdissection,6 laser tweezers7 or multi-focus Raman tweezers,8 and flow cytometry.9 However, such techniques always suffer from labor-intensive, inefficient workflows and high loss, where microfluidic and digital microfluidic systems can play a better role.1 Microfluidic systems have been widely used in high-throughput chemistry and biology, where the droplets are manipulated for classification or analyzed for particle counting with a high speed.10,11 Combined with some local structures such as a situ impedance array,12,13,14 the systems can also be applied on more complicated projects to observe the replicative aging process of yeast cells and to investigate the key elements which influenced the aging process.15,16 However, the variety in the size and morphology of yeast cells during their aging process might cause the failure in trapping and cultivating them in the array during long-term imaging.11 One solution is to adopt water-in-oil emulsion droplets17 in order to encapsulate the particles inside individual droplets without additional structures, but droplets are manipulated by gravity or pressure, which means that it is hard for individual droplets to move freely as needed for some complicated sorting or mixing process.
A digital microfluidic (DMF) system is proposed to realize on-demand droplet control. The discrete droplets are manipulated by electrostatic forces controlled by the electrodes array on a chip, moving from hydrophobic to hydrophilic spots that vary with the voltage signals. With a DMF system, multiple droplets containing different particles can be manipulated simultaneously, independently, and precisely,18 such as droplet splitting, mixing of different reagents, or the adjustment of different concentrations, which fits more requirements in single-cell cultivation and analysis. In some previous works, the DMF chips were combined with micro-channels19,20,21 to further limit the shapes and volume of droplets, while the design and process costs were much higher. Furthermore, conventional imaging systems combined with DMF generally ignore the depth of the channels, which can cause a statistical loss of cell number or fluorescence brightness. Several axial images were usually taken to form a stereoscopic global image to solve this problem,22 while the optical refocusing wasted a lot of time. Several works were conducted to optically extend the depth of field (EDoF), such as fast electrical refocusing,23,24,25,26 digital refocusing using light field measurements,27 and the pupil engineering methods. Among them, pupil engineering methods including Fresnel lenses,28 cubic phase mask,29 and logarithmic asphere30 manipulate the wavefront in the pupil plane so that the -axial point spread function (PSF) changes more slowly, allowing the depth of field to be optically extended without scanning in any spatial dimension with merely one shot, which was more effective. By employing this technology in the systems,31,32,33 the depth of field can cover almost the entire depth range to achieve rapid imaging. However, the distortion and costs introduced by such equipment should also be considered.
In this work, a novel single-cell control and analysis system combining a DMF chip with EDoF optical system is proposed for rapid imaging and analysis of single cells. The budding yeast Saccharomyces cerevisiae is observed as this strain is widely utilized in investigating fundamental cellular processes due to its fast and regular division, genetic tractability and ease of cultivation.34 The system is proven to have control and culture capabilities following the flowchart in Fig. 1. The single yeast cells were analyzed by observing their growth inside the cultivation array on the chip. A phase modulator is inserted as the EDoF system between the objective lens and the camera to cover the depth of the entire imaging region (Fig. 2(a)). Rapid analysis for the cell counting by the images has been achieved, and droplets containing only one single cell are guided into the array where the cell cultivation and periodical observations are conducted. According to the statistics of the cell numbers and the total fluorescence brightness of cells representing the cell production, the growth of different colonies can be observed and evaluated. The monoclonal colony with the highest production can be selected and extracted from the chip for further research. This work has demonstrated the single-cell sorting, culturing, and analysis capabilities of the system, which is expected to become an important tool in the field of single-cell research in the future.
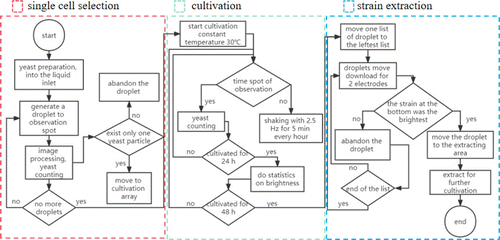
Fig. 1. The flowchart of the experiments, including the processes of single-cell sorting, cell cultivation, and the extraction of the colony with the highest production.
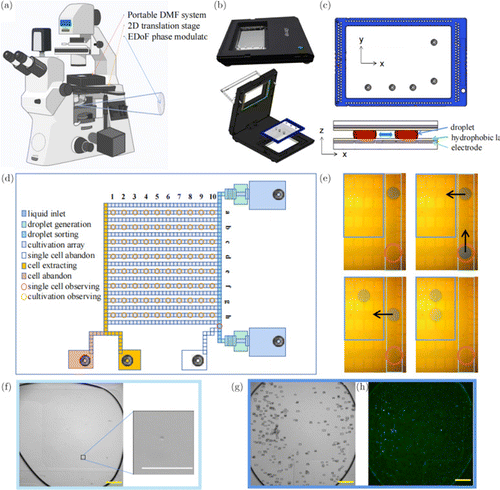
Fig. 2. The simple description of the DMF system. (a) The microscope equipped with the portable DMF system, a 2D translation stage, and the EDoF phase modulator. (b) The portable DMF system including the host and the chip, is mounted on the 2D translation platform. (c) The chip for manipulating the droplets. (d) The scheme of the chip with different function arrays. (e) The droplets can be controlled by the electrodes integrated on the chip, with the direction of movement indicated by the arrows, and recorded by microscope imaging. (f) The droplet containing a single yeast cell (see the inset) is observed. (g) The single yeast cell is cultured in the array for 36h and this array is observed continuously. Each box represents a yeast cell at 36h in the bright-field image. (h) The fluorescence image is obtained at 36h to estimate the production of GFP. Scale bar: 200m.
2. Materials and Methods
2.1. Cultivation of yeast
The S. cerevisiae yeast strain w303-1a-GFP stably expressing green fluorescence protein (GFP) was used in all experiments. The yeast has been gene-edited on the plasmid YIplac211, where an EGFP is added, so that GFP is produced stably in the cytoplasm of the yeast cells. As a result of the expression of the plasmid, the GFP accumulates inside the cells. By observing the fluorescence brightness of the cells, the production of the GFP can be figured out, which corresponded to the growing situation of the yeast cell and the expression of the plasmid gene. By figuring out the colony with the highest production of GFP, the system can be used for yeast cells sorting and observation with heterogeneities during their growth, which is important in single-cell analysis.
In the first pre-cultivation, the yeast grew in 6mL yeast peptone dextrose (YPD) containing 0.3g YPD Broth (A507022, Sangon Biotech, Shanghai, China) and 6mL double-distilled water, which was kept at 30∘C and agitated at a speed of 220 RPM for 12h to activate the yeast cells. Before the formal experiment, 2L suspension was diluted by 1mL solution of SC (Synthetic complete medium, liquid), which was composed of 0.67% YNB (Yeast Nitrogen Base) without amino acids, and 2% glucose, additionally, 20mg/L Arg, 100mg/L Asp, 100 mg/L Glu, 20mg/L His, 300mg/L Ile, 60mg/L Leu, 30mg/L Lys, 20mg/L Met, 50mg/L Phe, 375mg/L Ser, 200mg/L Thr, 40mg/L Trp, 30mg/L Tyr, 150mg/L Val, and 20mg/L Ura were added. Then 20L of the new suspension was added into another 1 mL SC solution so that the final suspension was thin enough to ensure that no more than one yeast cell was in a single droplet (0.1L suspension). The dilution process mixed around 0.04L original suspension to 1mL solution of SC, making the cells in the droplet fit a Poisson Distribution with an expectation much lower than 1, which was close to Bernoulli Distribution. The final suspension was injected into the DMF chip for the following operations.
2.2. The DMF chip
The DMF system named iDrop including the holder and the chip is shown in Fig. 2(b) and the details of the chip are shown in Figs. 2(c) and 2(d). The chip consists of three layers: the digital microfluidic electrodes, the hydrophobic layer, and the channel layer. The probes on the holder send DC square-wave voltage signals with a high level of up to 95 V to the electrodes on the chip through the interfaces at the borders. The square-wave signal controls the voltage changes on the related electrodes to change the hydrophilicity of the hydrophobic layer. The motions of the droplets can be manipulated by changing the square-wave voltages between adjacent electrodes, while the changing of the voltages is controlled by the hexadecimal-number commands in the background software. The electrodes are divided into multiple working spaces, including two liquid inlets, two droplet generators, the droplet mixing and sorting lists, the cultivation arrays and three liquid intakes. During the single-cell selection, only the spot at the bottom right of the sorting list needs to be observed (Fig. 2(d)). As the size of each electrode on the channel is 1mm1mm, and the height of the channel layer is 100m, each pulled-out droplet should have a volume of around 0.1L. When the yeast liquid is diluted enough, there may be no more than one cell in a droplet. If the droplet is determined to contain a single cell by the cell-counting program, it is guided into the culture array for further observation; otherwise it is abandoned into the liquid intake (Fig. 2(e)). The observation and the cell-counting are conducted as shown in Fig. 2(f), which is further discussed in the design of the program.
After the single-cell selection, the droplets containing cells in the cultivation array are shuttled between two adjacent electrodes with a steady frequency, to keep the activity of the yeast cells and avoid the cells aggregating or sticking to the base during the exponential phase of growth. The droplets are shaken for 5 min every hour at a frequency of 2.5Hz at 30∘C.
When observing the cells, each electrode in the cultivation array that holds the droplets needs to be focused by using the 2D translation stage (shown in Fig. 2(a)). For each droplet, both the bright-field image and the fluorescence image are taken as presented in Figs. 2(g) and 2(h). There are 510 electrodes in the array, and since the shaking action requires three adjacent electrodes, the array can hold up to 170 droplets. To avoid the situation where two adjacent droplets merge by accident, a maximum of 80 droplets can be used at a time for cultivation observation (Fig. 2(d)).
After the cultivation for 48h, all the colonies are analyzed and the droplet containing the colony with the highest production is guided into the cell extracting region in Fig. 2(d); otherwise, the droplets are guided to the cell abandoning region at the far left area of the chip.
2.3. The optical system
An Olympus IX83 microscope (Olympus Optical Ltd, Japan) equipped with a 10Olympus object lens () and an EDoF phase modulator is used to observe the droplets (Fig. S1(a)). The Hamamatsu C11440-42U30 camera (Hamamatsu, Japan) has effective pixels of , and each pixel size is 6.5m6.5m, so each image is 13.312mm13.312mm. The GFP fluorescence is excited by a mercury lamp with a bandpass filter of 457–487nm, and collected with a 503–538nm bandpass filter.
The channel layer of the chip has a height of 100m. Since the condenser numerical aperture of the mercury lamp as exciting illuminant is small enough, and the images are taken under coherent light with a central wavelength of 510nm, the depth of field of the objective lens can be estimated according to
The EDoF system contains a circularly-symmetric phase mask33 defined as follows:
2.4. Image processing system and data analysis program
To keep proper contrast, images captured by the EDoF system are subjected a simple 2D deconvolution (Lucy–Richardson) with one PSF of the system, which guarantees the accuracy of subsequent image processing. Lucy–Richardson Deconvolution is selected as this algorithm fitted the Poisson Distribution rules that could describe almost all imaging systems and approximated the result iteratively, which is adopted widely. Then, the images are sent to the image processing system whose flowchart is shown in Fig. S1(b), for yeast counting. The program is based on python 3.7.9 and OpenCV 4.4.0. Both the cell number in the bright-filed images and the fluorescence brightness within the cell contours in the fluorescence images can be calculated by the program. It should be noted that during the single-cell sorting and the first 24 h of incubation, the fluorescence images were not recorded, as the fluorescence excitation may interfere with the cell growth. Fluorescence images were recorded when growth reached a stable phase, with a time interval of 6 to 12h.
Most of the processing program is integrated in the same python program, which is commonly used throughout the project. However, when performing the fluorescence calculation, the fluorescence background of the droplet should be adaptively removed in advance before mapping the masks of the yeast cells given by the bright-field image to the corresponding fluorescence image, which is taken from the same droplet at the same time. This process is conducted in parallel with the main program utilizing the Subtract Background function in ImageJ (National Institutes of Health, Maryland) when the fluorescence images are taken.
3. Experiment and Results
3.1. The imaging ability of the optical system
The optical system in this work combines the DMF system and the EDoF system together. To estimate the imaging ability of the system, several fluorescence images of the suspension droplets containing several yeast cells from the same batch are observed on the chip. During the observation, the sizes of the droplets gather within a stable range, as presented in Fig. 3(a). According to the parameters of the camera, the 2D image covers an area of 1mm2, which typically covers around 85.4% of the droplet area.
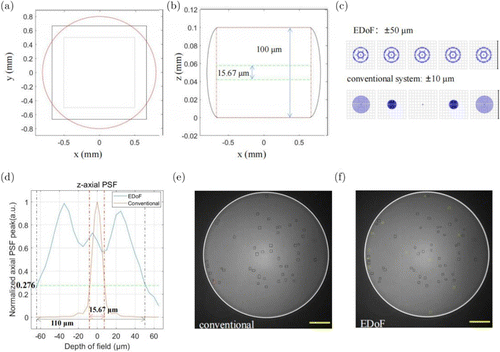
Fig. 3. The test of the optical system in simulation and reality. (a) The image captured by the camera and the region it covers in the droplet. (b) The -axial occupation of the image captured by the conventional system (green box) and the EDoF system (red box). (c) The comparison of the focal point maps of the EDoF and the conventional system. (d) The normalized axial PSF peaks of the EDoF and the conventional system. (e) and (f) showed different cell counts of the same droplet obtained by different systems. The conventional system without EDoF captured 49 cell counts (e), while the EDoF system figured out 60 cell counts (f). Scale bar: 200m.
While in the -axial imaging (Fig. 3(b)), the EDoF system can theoretically cover droplets with a depth over 110m as the nominal limit of the defocus distance is set as 130m (75m on both sides). In the simulation according to the optical system, the through-focal spot diagram in Fig. 3(c) and the -axial PSF shown in Fig. 3(d) are achieved. According to the comparison in the focal spots, though the spots of the posted system throughput in an area of m2, which is larger than the m2 of the conventional system, the spot remains stable in the depth range of 50m as that of the conventional system decays dramatically within 10m. The PSF values of the conventional system decays rapidly by 10 times in a range of 20m (−10m to 10m), which is unacceptable. Whereas for a range of over 100m (−50m to 50m) in the posted system, the normalized peak of the PSF remained above 0.276, which is the exact value at the DoF of the conventional system. As the depth of field of a conventional system (whose PSF is shown as the green line in Fig. 3(d)) is 7.833m, such attenuation occurs within a range from −60m to 50m in the EDoF system, proving that the system can theoretically cover 110m in depth.
As the 2D image covers around 85.4% of the droplet in the – plane, the original figure covers only around 13.3% () of the whole droplet, while theoretically, the system with the EDoF system covers 85.4% of the droplet. To ensure that the particles in the droplet are completely covered, the droplet is then shaken in the list and observed three times, so that the probability of missing one particle is decreased to 0.31%, which could be ignored. When conducting statistics on the brightness of the fluorescence images, however, just one image is taken, and only the effective area of that image is considered, since it could represent the trend of the growth.
Figures 3(e) and 3(f) exhibit an example to show different cell count results of the same droplet obtained by two different systems. The switching between the two systems only needs to change phase modules rapidly, and this switching time is negligible as the yeast cells kept suspending in the droplet for around 30 s to 1 min. For the same droplet, the image captured by the conventional system (Fig. 3(e)) contained 49 spots, while 60 spots were captured by the EDoF system where more signals were detected and marked by the green boxes (Fig. 3(f)). But one signal in the red box shown in Fig. 3(e) was missed by the EDoF which might be caused by the blurriness. Generally, the depth of field has been greatly extended to better fit the chip.
3.2. Image processing algorithm conducting
In the program, before the processing of the suspension droplets, a pure water droplet is generated from another liquid inlet and guided to the observation point. A figure is taken for the droplet as the background for reference, and the subtracted images of the suspension droplets and this background image are further processed. The rest of the droplet boundaries, and the contours of the yeasts are recognized in these subtracted figures using an adaptive threshold algorithm, which extracts edge information by calculating local thresholds according to the brightness distribution of different areas in the images (Figs. 4(a) and 4(d)), to fit the brightness change of the screen plane. The contour containing the largest area represents the droplet boundary, whose connected region and the regions outside that domain should be discarded as shown in Figs. 4(b) and 4(e). If the contour is connected to the border of the image, the edges between two breakpoints are set as 1 to ensure the full connection of the contour. Then the contours in the preserved area are divided, recognized, and counted, and the results are presented with small boxes in Figs. 4(c) and 4(f).
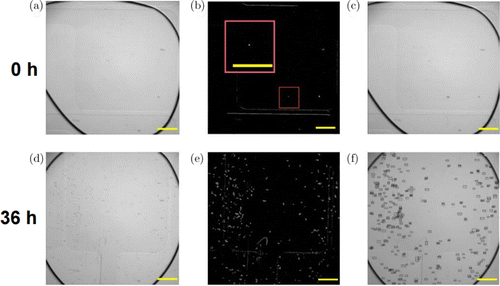
Fig. 4. The image processing program, taking a yeast cell at 0 h (a)–(c) and its clones at 36h (d)–(f) as an example. (a) and (d) The images with LR deconvolution. (b) and (e) The contours of the particles (yeast cells) inside the droplet, extracted from images (a) and (d). (c) and (f) Counting results marked with small boxes, a single cell (c) and 65540 yeast cells (f) were, respectively, estimated. Scale bar: 200m.
To ensure that the particles extracted are exactly yeast cells, several restrictions have been added to the program. First, the area of the particles should be larger than 25m2, which is the smallest yeast size observed by this work, and is also consistent with the previous report for S. cerevisiae.35 In the images obtained by the EDoF system, 25m2 corresponds to 60 pixels. Meanwhile, the circularity of the particles, meaning , where means the perimeter and is the area, is also taken into consideration. The circularity of single cells should tend to be 1, however as the cells may stick to each other, which causes the rapid decaying in circularity. As the particles in the images are not large enough this time, they are always identified as irregular spots as shown in Fig. 4(e), whose circularities are not as stable as the ellipses. So, a rough threshold of 0.1 is defined, aiming to differentiate yeast cells from thin lines at the edges of the electrodes in the background.
To estimate the cell numbers with the cell growth and division, the extracted areas are divided by the statistical average area of yeast cell, which is around 48.6m2 according to our statistics in this work, as well as previous report.35 Considering the yeast size distribution, this can lead to an error of around 6.3%. Taking Fig. 4(f) as an example, the estimation error for 655 cells is about 40.
After contours of the yeast are extracted, the regions within the contours are set as a mask mapping to the fluorescence image. The total preserved grayscale was recorded as the criterion of the production of GFP in the corresponding colony, and the average production of single cell is figured out as the total grayscale divided by the estimated number of yeasts.
3.3. The growth of the yeast
Because yeast exhibits heterogeneity with growth and division, we aimed to identify the single cell with the fastest growth and the highest GFP production by the application of the DMF system combined with EDoF. As mentioned in Sec. 2.2, a maximum of 80 droplets can be analyzed at a time for cultivation observation. Among these 80 droplets, 32 droplets were identified as containing a single cell, and the rest were empty droplets or droplets with more than one cell. Among the 32 single cells, 14 particles posed difficulty in growth due to aging or electrical breakdown, as the dead cells and other sub-visible particles also had a size around 100 pixels and a circularity over 0.4, which was difficult to recognize. Finally, 18 single cells grew in the culture array and were observed for 48h, and the 18 colonies were numbered as No. 1–18 in the following part.
Figure 5 shows the growth of No. 8 and No. 11 as two examples at 5 time points. In general, the yeast growth has an exponential phase from 6h to 24h and then reached the stationary phase, which is shown in Fig. 6(a). Among the 18 colonies, No. 11 exhibited the fastest growth, while No. 8 was the lowest one. The result also showed the heterogeneity of different cells in the growth obviously (Fig. 6(b)). No. 11 colony grew from one cell to over 8000 cells within 36h, which grew and divided the fastest. While No. 8 colony only grew into about 650 cells, which was more than 12 times lower than No. 11. Most of the colonies finally grew to over 4000 cells at 36h. The highest total number of cells is about 85.5% higher than the mean number, showing the remarkable heterogeneity in division.
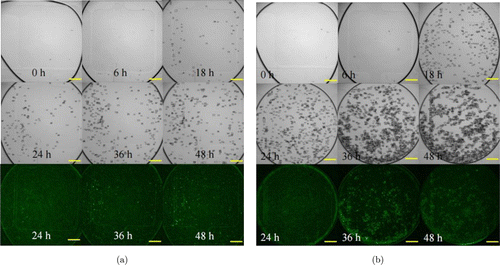
Fig. 5. The growth of yeast. Droplets were observed at 0, 6, 18, 24, 36, and 48h, respectively. The fluorescent images were taken at 24, 36, and 48h. (a) No. 8 colony, which was the slowest in growth. (b) No. 11 colony, which grew faster than No. 8 had the highest GFP production. Scale bar: 200m.
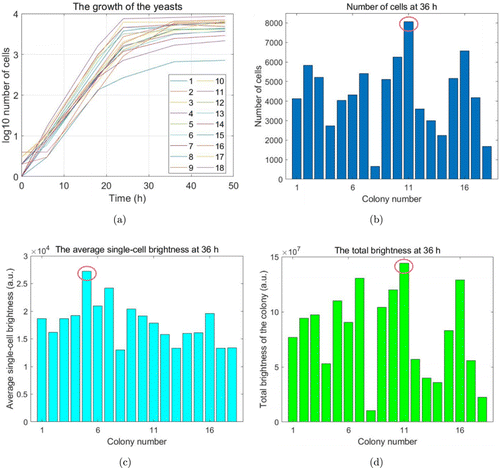
Fig. 6. The statistics and analysis on the colonies. (a) The growth of the yeasts in the 18 droplets by counting the number of cell contours. (b) The number of cells in each colony at 36h. (c) The average brightness of one cell in each colony at 36h, coming from total brightness divided by the number of cells. (d) The total brightness of each colony at 36h.
GFP production is evaluated in two ways for the 18 colonies. One is the average brightness of single cell in each colony (Fig. 6(c)), for example, No. 5 was the highest and 52.3% brighter than the average value at 36h. The other is the total brightness of GFP for each colony (Fig. 6(d)), which is influenced by two factors, the number of cells and the GFP brightness of single cell. Figure 6(d) shows that the total brightness of No. 11 is much higher than that of others. Although the single-cell GFP brightness in No. 11 is not the highest, it has the highest number of cells. Following the two ways, the colony with the highest protein production or the fastest divisions can be selected for different application requirements.
To demonstrate the potential of the DMF system in single-cell analysis, a control experiment was also conducted. A wild S. cerevisiae yeast strain w303-1a was also cultured and observed by the system to ensure that different strains could be cultured and observed in the same chip. After a growth of 36h, the colonies of this wild strain also reached a cell number of over 1000 (Fig. S2(a)), while in the fluorescence test, there were no obvious fluorescence signal that differ from the background, which only left an intensity of around 290 per pixel recognized as the autofluorescence of the cells (Fig. S2(b)), more than three times lower than that of the w303-1a-GFP, which proved that the differences between the strains could be analyzed in this system.
4. Discussion
Compared to the previous works,13,14,15,16,17,19,20,21 as the system is only based on different sizes of dispersed electrodes without any situ impedance or micro-channels in the structure, there exists more freedom in the manipulation of the droplets. The yeast growth is not limited by the shape of the traps and the movements of the droplets are not jammed by cells of large sizes. As the voltage changed on an electrode takes around 50ms and the USB communication between the host computer and the DMF system is only 1–2ms, high throughput, high-speed volumetric imaging can be realized.
In the referred reports,31,32,33 the modulator is settled out of the microscope where the back pupil plane of the objective lens is relayed onto the system, to avoid interfering with the packaged microscope system. However, in the present optical system, the plate is inserted directly into the focal plane of the objective lens. As the two points are conjugated theoretically, there are no extra impacts on the image. Though the phase modulator introduces blurriness to the image, the cell-counting could be pre-processed by deconvolution algorithms to enhance the contrast and remove the side lobes of the PSF. Take image Fig. 3(f) as an example, it has gone through 8 iterates of deconvolution. Compared to the original figure, the contrast is apparently improved and the contours of the particles are clearer. So the cell-counting process is conducted after such a process. However, the blurriness still needs further solutions like considering more stationary points to optimize the shape of the axial PSF. A basic L-R Deconvolution program is utilized in the pre-processing, while rapid deconvolution utilizing a back-projection operator and deep learning36 might operate better and faster, which also needs further research. A camera with a wider view and the improved structure of the chip may enhance the ability of the system further.
The cells are counted according to the contours extracted by thresholds. To deal with the complicated electrode background, removing the droplet contour is necessary. This process could retain over 95% of the cells in the interested regions in most cases, especially when they are sparse. However, when the yeast cells gathered in the late cultivation period, the contours are difficult to segment and in the worst situation, the yeast cells stick to the edges of the droplets, where the recognition of the outlines is also interfered. Taking the errors of the algorithm and the interference from the cells sticking to the edges, when the cells become dense, the accuracy could decrease to around 85%. Additionally, several other particles like plastic debris with sizes of 2–10m could be recognized as single cells by mistake. So, more powerful approaches like convolutional neural networks (CNNs) could be introduced into cell counting and image segmentation.
5. Conclusion
This work used the DMF chip combined with the EDoF optical system to realize the single-cell manipulation and cultivation. The DMF chip solves the problem of fast droplet manipulation and the limited yeast sizes, and the EDoF system combining deconvolution algorithm solves the problem of limited depth of field. The system is used to capture a single image covering almost the entire droplet, and based on the image processing results, the cell numbers and the fluorescent protein production are estimated. This result has demonstrated the ability of the system for single-cell control, cultivation, and analysis, as a platform for droplet manipulation and high throughput observation.
Conflict of Interest
The authors declare that there are no conflicts of interest regarding the publication of this paper.
Acknowledgments
This work was financially supported by the National Key R&D Program of China (2021YFF0502900), the National Natural Science Foundation of China (62175034, 62175036), the Anhui Province Key R&D Project (202003a07020020), the Shanghai Natural Science Foundation (grant No. 20ZR1405100), the Science and Technology Research Program of Shanghai (grant No. 19DZ2282100), the Shanghai key discipline construction plan (2020-2022) (grant No. GWV-10.1-XK01), the Shanghai Engineering Technology Research Center of Hair Medicine (19DZ2250500), the Medical Engineering Fund of Fudan University (yg2021-022), the Pioneering Project of Academy for Engineering and Technology, the Fudan University (gyy2018-001, gyy2018-002), and the Yantai Returned Scholars’ Pioneering Park.
References
- 1. , “Single-Cell digital microfluidic mass spectrometry platform for efficient and multiplex genotyping of circulating tumor cells,” Anal. Chem. 94(2), 1108–1117 (2022). Crossref, Web of Science, Google Scholar
- 2. S. Gmez, A. Co, S. Vilet, M. Ackermann, “Microfluidics for single-cell study of antibiotic tolerance and persistence induced by nutrient limitation” (2020), http://arxiv.org/abs/2010.14703. Google Scholar
- 3. , “Detection and application of microfluidic isothermal amplification on chip,” J. Innov. Opt. Health. Sci. 1(2), 257–265 (2008). Link, Web of Science, Google Scholar
- 4. , “A microfluidic digital single-cell assay for the evaluation of anticancer drugs,” Anal. Bioanal. Chem. 407, 1139–1148 (2015). Crossref, Web of Science, Google Scholar
- 5. , “Label-Free Enrichment and Molecular Characterization of Viable Circulating Tumor Cells from Diagnostic Leukapheresis Products,” Clin. Chem. 65, 549–558 (2019). Crossref, Web of Science, Google Scholar
- 6. , “Whole Genome Sequencing of Single Circulating Tumor Cells Isolated by Applying a Pulsed Laser to Cell-Capturing Microstructures,” Small. 15, 1902607 (2019). Crossref, Web of Science, Google Scholar
- 7. , “Forces of RBC interaction with single endothelial cells in stationary conditions: Measurements with laser tweezers,” J. Innov. Opt. Health. Sci. 14(5), 2142005 (2021). Link, Web of Science, Google Scholar
- 8. , “Combination of multi-focus Raman spectroscopy and compressive sensing for parallel monitoring of single-cell dynamics,” J. Innov. Opt. Health. Sci. 14(6), 2150021 (2021). Link, Web of Science, Google Scholar
- 9. , “An integrated flow cytometry-based platform for isolation and molecular characterization of circulating tumor single cells and clusters,” Sci. Rep. 8, 5035 (2018). Crossref, Web of Science, Google Scholar
- 10. , “Collaborative study for analysis of subvisible particles using flow imaging and light obscuration: Experiences in Japanese biopharmaceutical consortium,” J. Pharm. Sci. 108, 832–841 (2019). Crossref, Web of Science, Google Scholar
- 11. , “Ultrahigh-throughput screening in drop-based microfluidics for directed evolution,” Proc. Natl. Acad. Sci. U. S. A. 107, 4004–4009 (2010). Crossref, Web of Science, Google Scholar
- 12. , “Simulation and measurement of flow field in microchip,” J. Innov. Opt. Health. Sci. 3(1), 25–30 (2010). Link, Web of Science, Google Scholar
- 13. , “Design and 3D modeling investigation of a microfluidic electrode array for electrical impedance measurement of single yeast cells,” Electrophoresis 42, 1996–2009 (2021). Crossref, Web of Science, Google Scholar
- 14. , “Complementary performances of convolutional and capsule neural networks on classifying microfluidic images of dividing yeast cells,” PLoS One 16(3), e0246988 (2017). Google Scholar
- 15. , “A high-throughput microfluidic diploid yeast long-term culturing (DYLC) chip capable of bud reorientation and concerted daughter dissection for replicative lifespan determination,” J. Nanobiotechnol. 20, 171 (2022). Crossref, Web of Science, Google Scholar
- 16. , “Positive-feedback, ratiometric biosensor expression improves high-throughput metabolite-producer screening efficiency in yeast,” Synth. Biol.(Oxf). 2(1), ysw002 (2017). Crossref, Google Scholar
- 17. , “Droplet microfluidics for high-throughput biological assays,” Lab Chip. 12(12), 2146–2155 (2012). Crossref, Web of Science, Google Scholar
- 18. , “An integrated droplet-digital microfluidic system for on-demand droplet creation, mixing, incubation, and sorting,” Lab Chip. 19(3), 524–535 (2019). Crossref, Web of Science, Google Scholar
- 19. , “A Versatile Microfluidic Device for Automating Synthetic Biology,” ACS. Synth. Biol. 4(10), 1151–1164 (2015). Crossref, Web of Science, Google Scholar
- 20. , “A droplet-to-digital (D2D) microfluidic device for single cell assays,” Lab Chip. 15(1), 225–236 (2015). Crossref, Web of Science, Google Scholar
- 21. , “Electrostatic potential wells for on-demand drop manipulation in microchannels,” Lab Chip. 14(5), 883–891 (2014). Crossref, Web of Science, Google Scholar
- 22. , “A 2.5D YOLO-based fusion algorithm for 3D localization of cells,” 53rd Asilomar Conf. Signals, Systems, and Computers (2019). Crossref, Google Scholar
- 23. , “Estimating network changes from lifespan measurements using a parsimonious gene network model of cellular aging,” BMC Bioinformatics 20, 599 (2019). Crossref, Web of Science, Google Scholar
- 24. , “Fast 3-D temporal focusing microscopy using an electrically tunable lens,” Opt. Express 23(19), 24362–24368 (2015). Crossref, Web of Science, Google Scholar
- 25. , “Extended depth-of-field microscopic imaging with a variable focus microscope objective,” Opt. Express 19(1), 353–362 (2011). Crossref, Web of Science, Google Scholar
- 26. , “Extended depth-of-field microscopy with a high-speed deformable mirror,” Opt. Lett. 42(5), 995–998 (2017). Crossref, Web of Science, Google Scholar
- 27. , “Simultaneous whole-animal 3D imaging of neuronal activity using light-field microscopy,” Nat. Methods 11(7), 727–730 (2014). Crossref, Web of Science, Google Scholar
- 28. , “Experimental realization of an imaging system with an extended depth of field,” Appl. Opt. 44(14), 2792–2798 (2005). Crossref, Web of Science, Google Scholar
- 29. , “Instantaneous three-dimensional sensing using spatial light modulator illumination with extended depth of field imaging,” Opt. Express 21(13), 16007–16021 (2013). Crossref, Web of Science, Google Scholar
- 30. , “Extended depth of field using a logarithmic asphere,” Pure Appl. Opt. 5(5), 157–163 (2003). Crossref, Google Scholar
- 31. , “Optical volumetric projection for fast 3D imaging through circularly symmetric pupil engineering,” Biomed. Opt. Express 9(2), 437–446 (2018). Crossref, Web of Science, Google Scholar
- 32. , “Optical volumetric projection with large NA objectives for fast high-resolution 3D imaging of neural signals,” Biomed. Opt. Express 11(7), 3769–3782 (2020). Crossref, Web of Science, Google Scholar
- 33. , “A Drop-in, focus-extending phase mask simplifies microscopic and microfluidic imaging systems for cost-effective point-of-care diagnostics,” Anal. Chem. (2022). https://doi.org/10.1021/acs.analchem.2c01421 Crossref, Web of Science, Google Scholar
- 34. , “Fast Inertia-Free Volumetric Light-Sheet Microscope,” ACS Photonics 4(7), 1797–1804 (2017). Crossref, Web of Science, Google Scholar
- 35. , “Yeast morphology assessment through automated image analysis during fermentation,” Fermentation 7, 44 (2021). Crossref, Google Scholar
- 36. , “Rapid image deconvolution and multiview fusion for optical microscopy,” Nat. Biotechnol. 38, 1337–1346 (2020). Crossref, Web of Science, Google Scholar

